Quotes
Simon Birkett, Founder and Director of Clean Air in London, said:
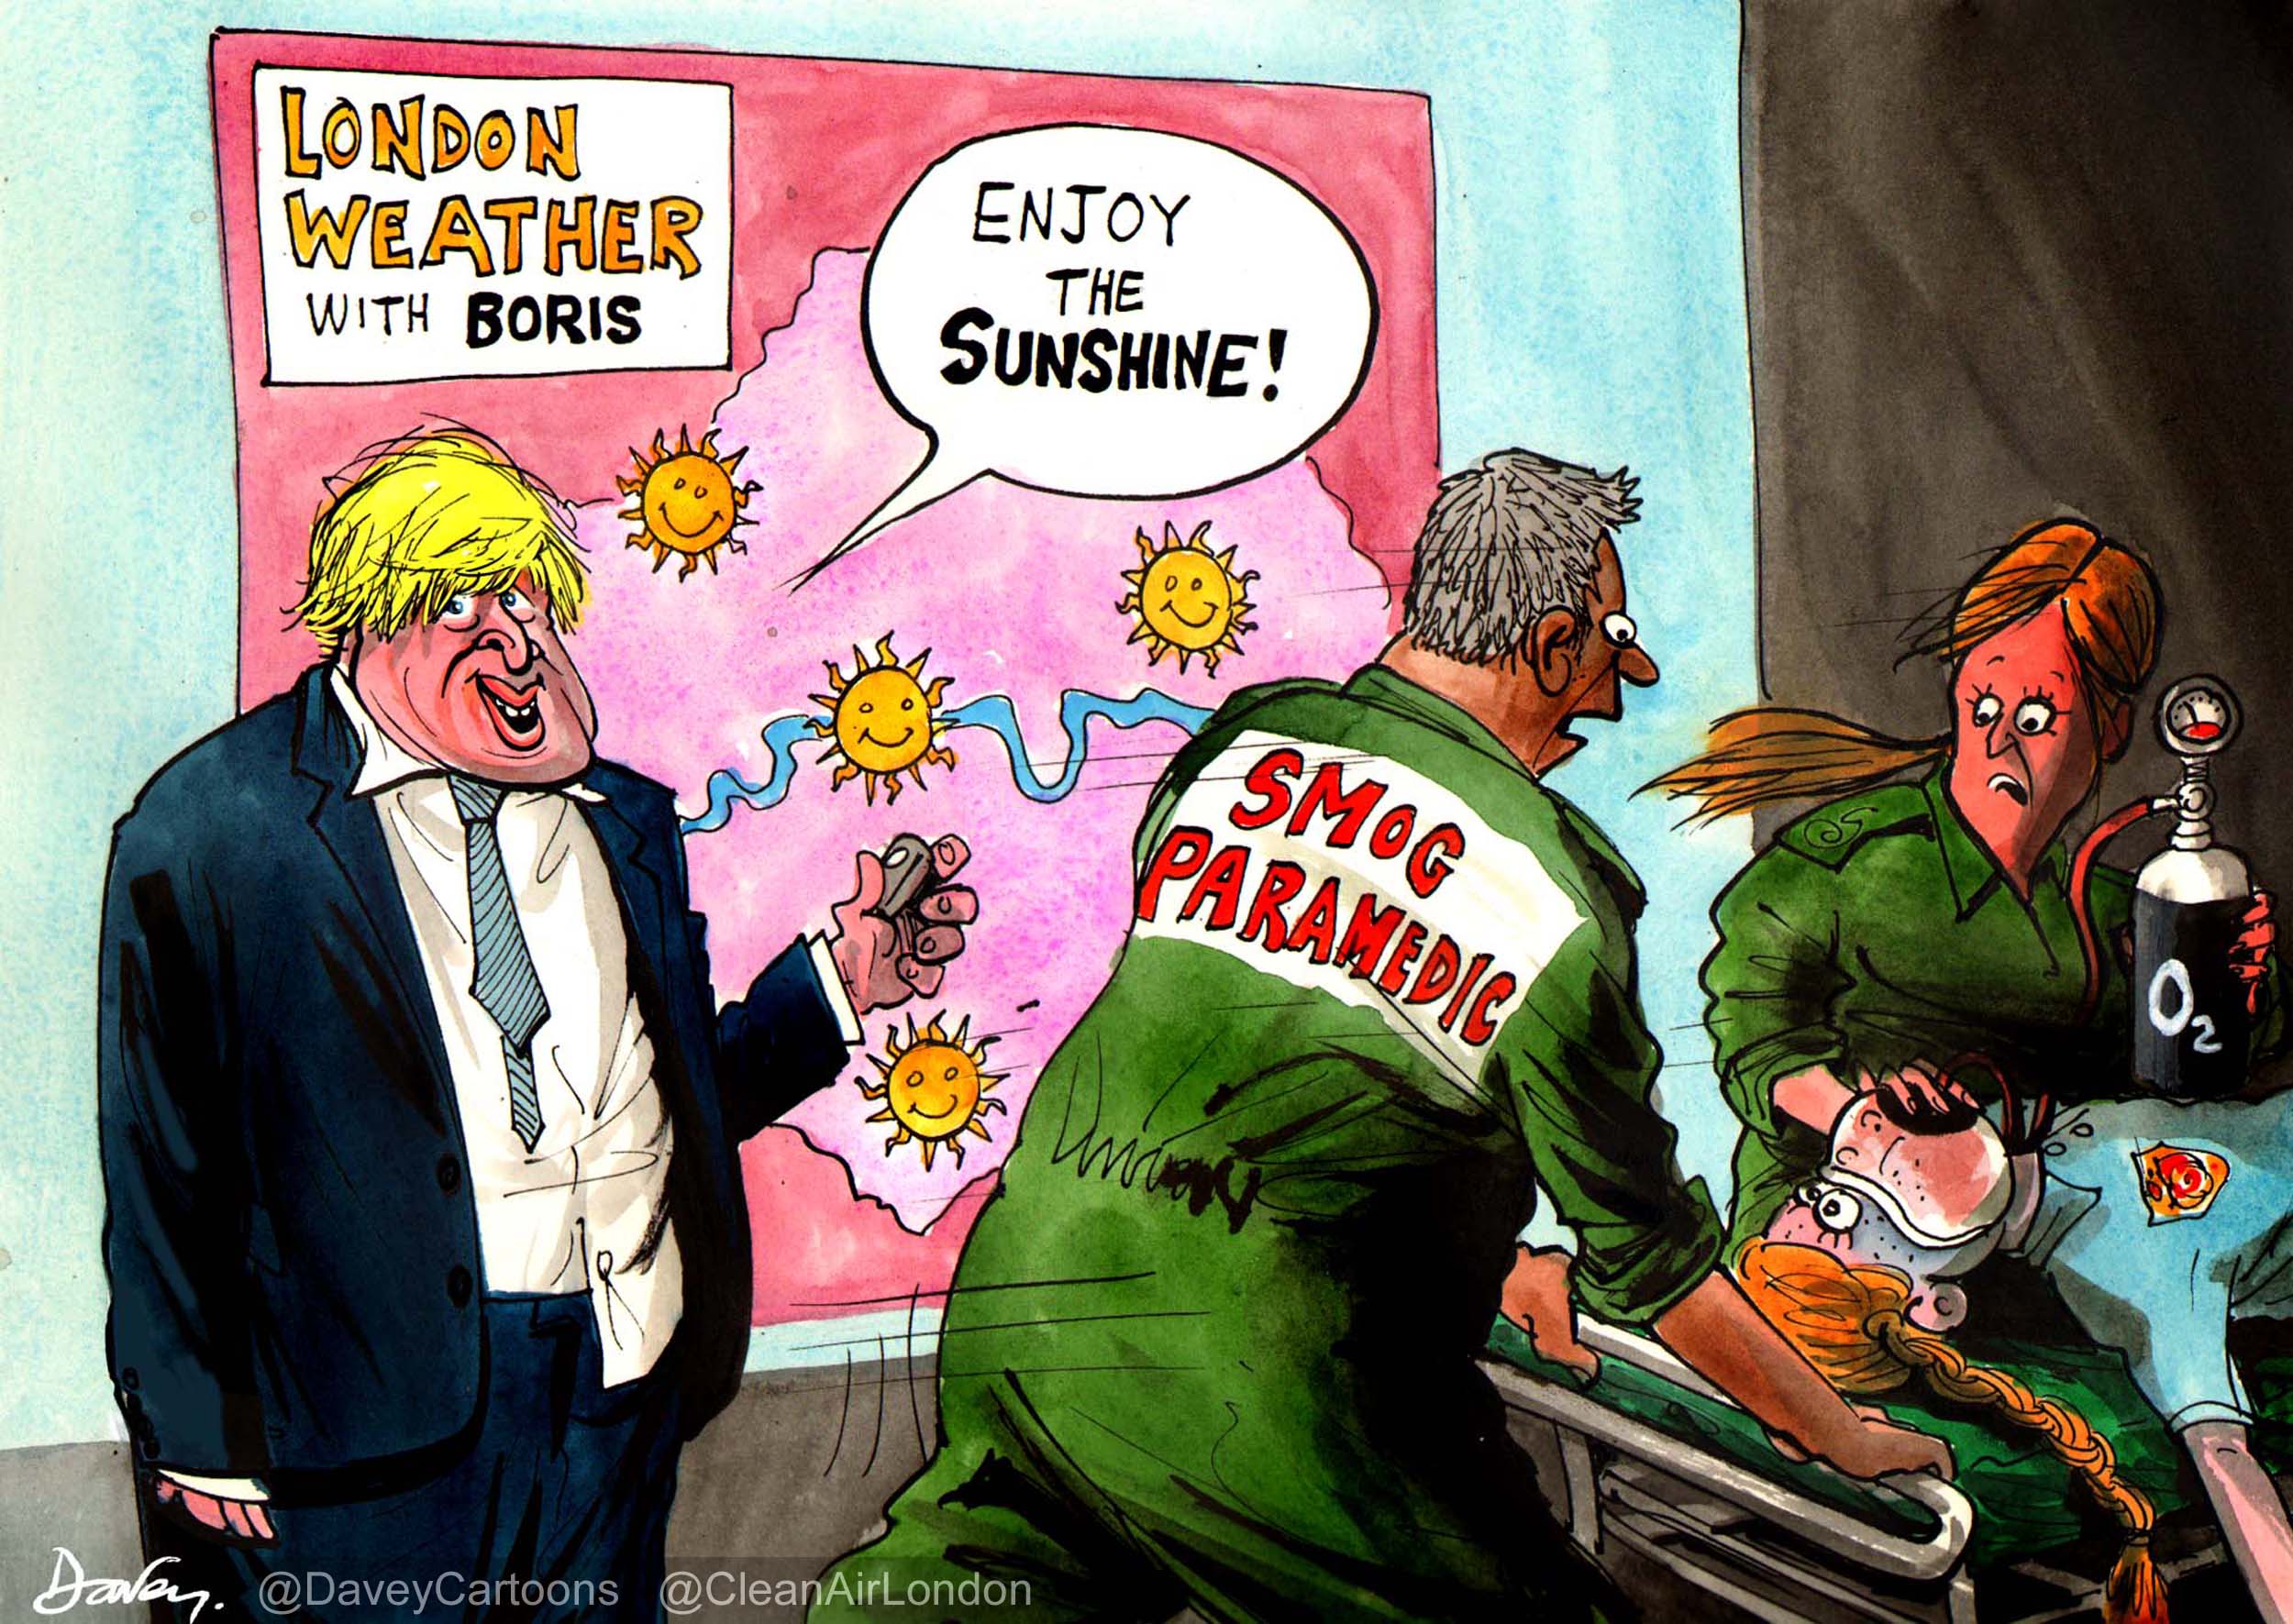
“Well done Boris for issuing his first HIGH air pollution warning since launching his Breathe Better Together campaign on 30 January this year.
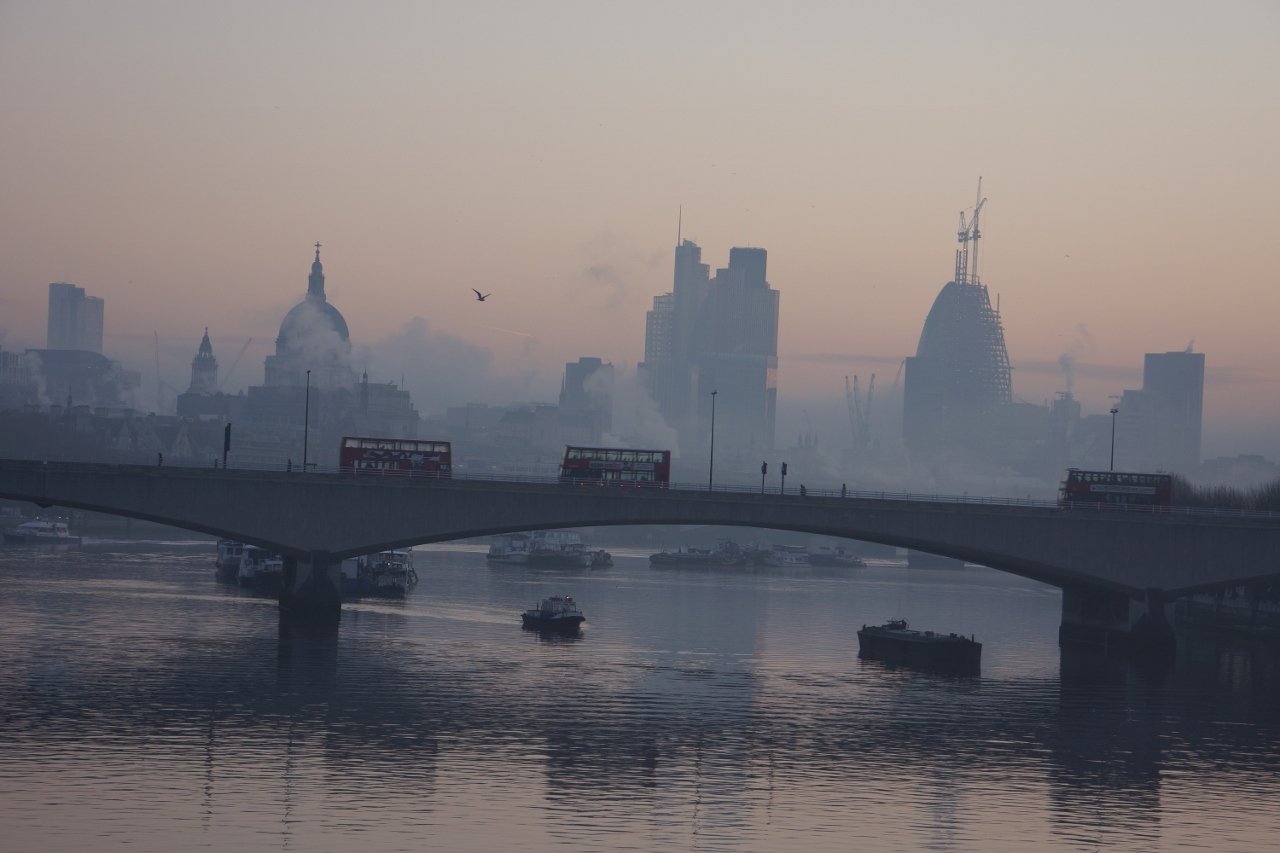
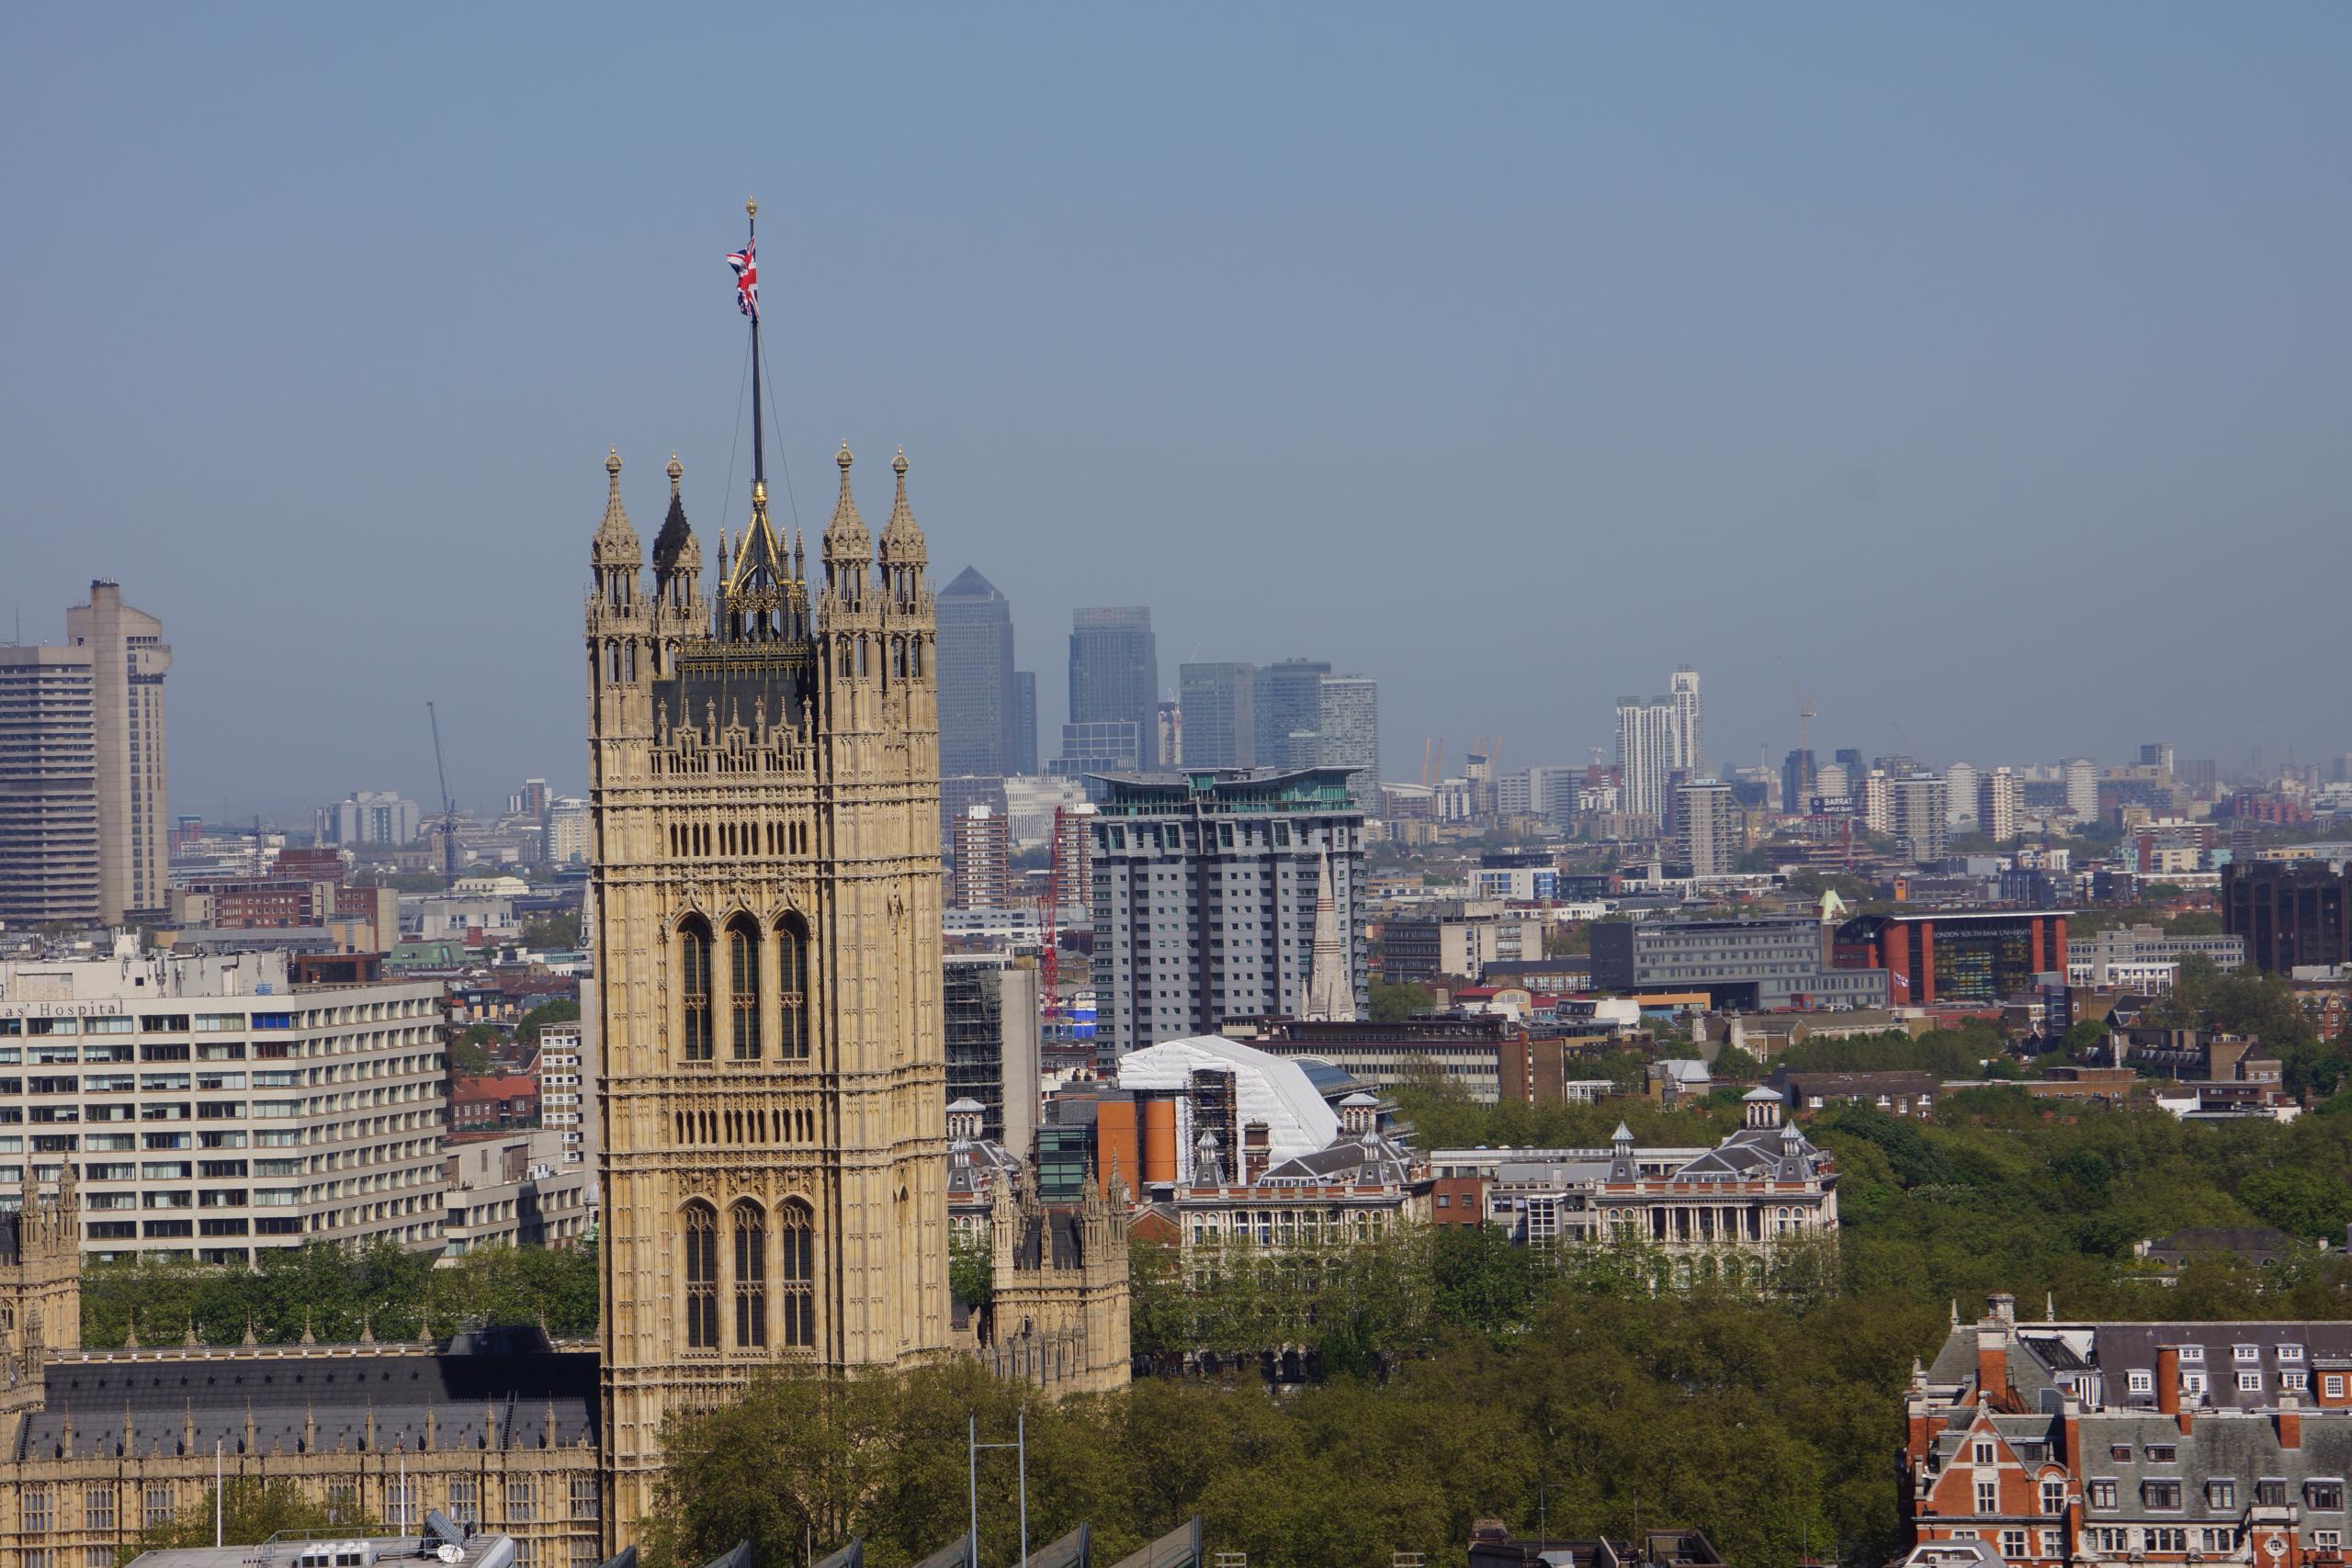
“This episode, the third of the year so far, is being caused by collapsing wind speeds and a change in wind direction that is bringing in air from the continent that has passed over heavily urbanised and industrialised areas. Easterly winds look set to worsen the problem for West London as it gets smothered in everyone’s air pollution. Air pollution monitors across London are expected to report HIGH particle levels at roadside and perhaps some background locations later today.
“Official health advice is that anyone experiencing discomfort such as sore eyes, cough or sore throat should consider reducing activity, particularly outdoors. At-risk individuals should take extra care and carry their medication with them today. The London Air Quality Network forecast, issued at noon on Tuesday 17 March, warned of worsening air pollution overnight with HIGH particle air pollution expected everywhere in London on Wednesday.
“Boris could improve his alert system by issuing warnings before the news cycle rather than after it begins and tweeting them himself to 1.2m followers.”
Notes
1. Breathe Better Together was launched on 30 January 2015
2. Breathe Better web page
https://www.london.gov.uk/priorities/environment/breathe-better-together
3. airTEXT forecasts
4. London Air Quality Network forecasts and episode reports
http://www.londonair.org.uk/LondonAir/Forecast/
http://www.londonair.org.uk/london/asp/publicbulletin.asp
http://www.londonair.org.uk/london/asp/publicepisodes.asp?region=0
5. Warning about (otherwise excellent) Met Office forecasts (used also by Defra)
The Met Office says:
“Defra maintains the [Automatic Urban and Rural Network] of air quality observation sites which provide measurements of pollutant concentration on an hourly basis across the UK. At the Met Office we use these observations to compare our forecasts against. In this way we are able to continuously monitor our forecast performance and to investigate reasons behind poor forecasts. This might occur, for example, if a new source of air pollution appears which is not accounted for in the annual average emission maps we use. In view of the fact that our model uses average emission maps and has grid boxes which are large compared to the road widths, our forecast does not represent the very localised increases in pollution that one might find close to roads in the urban environment. The forecast represents the background and regional air quality away from these strong sources of pollution.” [Clean Air in London emphasis]
http://www.metoffice.gov.uk/about-us/help/guides/air-quality-forecast
6. Health advice
http://www.londonair.org.uk/london/asp/airpollutionhealth.asp?HealthPage=HealthAdvice
6. Short vs long-term standards
Air pollution has short-term and long-term standards set for health and legal purposes. Short term standards for particle air pollution are being exceeded today. Annual limits for nitrogen dioxide, a toxic gas and the other main regulated pollutant, are breached year round across London with many roads in central London tending to have the highest concentrations in the world.
http://www.londonair.org.uk/london/asp/news.asp?NewsId=OxfordStHighNO2&StartIndex=31
8. Clean Air in London’s guide to air pollution episodes and useful links
https://cleanair.london/news/introduction-to-smog/

