Overview
Air pollution is the world’s largest single environmental health risk, killing an estimated seven million people each year.
The Clean Air in Cities App and Widgets were created by Clean Air in London to highlight the health impact of long-term exposure to human-made particle air pollution which is HIGH for many people in cities.
We wanted to address the problem created by Defra and others misleading people by highlighting only ‘LOW air pollution’ based on ‘Daily ALERT bandings’ for about 330 of 365 days per year. Instead, the App and Widgets highlight the health impact of long-term exposure to human-made particle air pollution which is MODERATE or HIGH for many people in cities. See:
The Clean Air in Cities App and Widgets report the health impact of long-term exposure to dangerous airborne particles (PM2.5) for the population in local areas, regions and England as a whole i.e. annual mean. The App and Widgets estimate the number of deaths attributable to air pollution on a pro rata, calendar year-to-date, basis and the time to the next attributable death as well as displaying the percentage of total deaths attributable to air pollution. They do not estimate or display the actual deaths from air pollution or the risk for an individual. Users can also see estimates for total population-weighted exposure to annual average concentrations of PM2.5 in different local areas and/or regions relative to the World Health Organisation guideline and England as a whole.
The Clean Air in Cities App and Widgets are available for iPhones, iPads and Android devices and can be downloaded from the appropriate store:
https://tinyurl.com/CAICandroid
Quotes
Simon Birkett, Founder and Director of Clean Air in London, said:
“Air pollution is the world’s largest single environmental health risk, killing an estimated seven million people each year.
“We therefore produced the Clean Air in Cities App and Widgets to highlight this risk and counter the impression created by successive governments that air pollution ‘LOW air pollution’ based on ‘Daily ALERT bandings’ for about 330 of 365 days per year. These daily alert levels were set to warn of health risks during major air pollution episodes not day to day exposure to air pollution.
“Instead, we highlight the health impact of long-term exposure to human-made particle air pollution (annual mean PM2.5) which is MODERATE or HIGH for many people in cities relative to the World Health Organisation guideline.
“Notifications from the App and Widgets keep us motivated to fight for clean air.
“We hope that other people will find the App and Widgets valuable and share their information widely.”
https://vimeo.com/cleanairlondon/app
CAL 381 Guide to the CAIC App and Widgets 281120 V3
Notes
The sections below have 20 top tips for using the App and 12 for using the Widgets. The App and Widgets use and publish the same underlying data.
Top 20 tips for using the ‘Clean Air in Cities’ App
1. The App is available free for iPhone, iPad and Android devices and can be downloaded from the appropriate store:
https://tinyurl.com/CAICandroid
2. The App was updated in 2021 for: the latest published data from Defra and Public Health England (2019); iOS 15 and Android 5 and up; bug fixes; performance enhancements; and the addition of news alerts. Don’t forget to check for app version 2.2 or later.
3. The Clean Air in Cities App was designed to address the misleading impression created by Defra and others highlighting only ‘LOW air pollution’ based on ‘Daily ALERT bandings’ for about 330 of 365 days per year. Instead, we highlight the health impact of long-term exposure to human-made particle air pollution which is MODERATE or HIGH for many people in cities. See:
https://www.who.int/news-room/fact-sheets/detail/ambient-(outdoor)-air-quality-and-health
https://www.who.int/airpollution/news-and-events/how-air-pollution-is-destroying-our-health
4. The App reports the percentage and number of deaths attributable to human-made fine particle air pollution (PM2.5) so far this year. It also uses the Clean Air in Cities Index® (also known as the Birkett Index®) to show total PM2.5 levels relative to the World Health Organisation’s latest guideline for human exposure to PM2.5 (published on 22 September 2021). By selecting ‘Always’ under ‘Show Previews’ for the ‘Clean Air in Cities app’ in ‘Notifications’ on ioS devices the notifications will appear in full on the face of the device to save you looking for it.
5. The App lets you share news or the latest estimate of deaths attributable to fine particle air pollution so far this year for any local authority or region in England or England as a whole e.g. by Email, Facebook, LinkedIn, Messaging, Twitter and WhatsApp.
6. The ‘+ ALL REGIONS’ button lets you add the nine regions in England; ‘+ ALL LOCAL AREAS’ adds all 150 local areas in England; and ‘+ ALL REGIONAL AREAS’ adds all areas in a region. These can be reset in settings.
7. The ‘+’ sign lets you search manually for local areas and regions and add them. Or let location services find your local area and others within your region. Please note that the search box will not suggest areas if they have already been selected e.g. through batch loading.
8. The ‘Edit’ button in the App allows you to re-order areas. We like to list all regions and all local areas in our region (in alphabetical order). Tip 6 shows how to do it automatically!
9. Why not add the nine regions including yours and then all your region’s local areas?
- East Midlands
- East of England
- London
- North East
- North West
- South East
- South West
- West Midlands
- Yorkshire and Humber
10. The App shows the percentage (%) of total deaths attributable to human-made particle air pollution (PM2.5) in every local authority and region in England.
11. The App shows population-weighted total concentrations of human-made fine particle air pollution (PM2.5) for any local area and region in England and England as a whole compared to the WHO guideline.
12. The App’s clock shows the proportion of time between deaths attributable to particle air pollution (PM2.5), actual time and flashes 15 seconds before the next statistical ‘death’.
13. The App could include Northern Ireland, Scotland and Wales (or other countries) if the relevant government would provide resources and the population-weighted PM2.5, attributable fraction and total deaths for it.
14. Ask politicians whether they use the App and know the latest estimate of deaths attributable to PM2.5 so far this year in their area
15. The ‘Website’, ‘News’ and ‘Settings’ buttons let you find out more about Clean Air in London’s work and the ‘Clean Air in Cities’ App. They include ‘Reset’ (or ‘Home’) and ‘Refresh’ buttons for their content.
16. The ‘News’ button lets you see selected ‘News alerts’ about air pollution episodes, blog posts and media stories posted by ‘Clean Air in London’. For examples, please see: https://cleanair.london/news-alerts/.
17. The App may send you useful notifications e.g. when the number of deaths attributable to particle air pollution in one of your areas reaches a significant milestone e.g. 5, 100 or 1,000 depending on the size of the area. It works best if you go to Settings -> Notifications -> Clean Air in Cities App -> ‘Banner style’ (persistent) and ‘Show previews’ (Always) for the App.
18. The App may send you occasional notifications (such as news or alerts about air pollution episodes) or links to new posts on Clean Air in London’s website.
19. The ‘Settings’ button lets you amend notifications, learn about the App, read our privacy statement and terms and conditions and reset all regions and areas.
20. Thank you for reading these tips. Please reply to one on Twitter with your own tips for improving our App or contact us at About https://cleanair.london/about/.
2. Top 12 tips for using the ‘Clean Air in Cities’ widgets
1. Two Clean Air in Cities Widgets, one small and one wide, are available for iphones, ipads [and android devices]. They display the most relevant and up-to-date air pollution data for any one local area, region or England as a whole on your home screen or notifications page. They mirror data in the App.
2. Before updating or loading your Clean Air in Cities App or Widgets, please allow Settings -> Privacy -> Location Services -> ‘On’. If the Clean Air in Cities app is already installed on your device, please Allow Location Access -> ‘While Using the App [or Widgets]’. This is necessary to install the Clean Air in Cities Widgets. You can edit or turn off this functionality later.
3. If ‘or Widgets’ does not appear in Location Access you will need to accept the pop-up ‘Allow widgets from ‘CleanAir‘ to use your location’ when installing the first Widget or allow ‘While Using the App or Widgets’ separately in Settings -> Privacy -> Location Services -> On -> Location Access after loading the Clean Air in Cities Widget.
4. Please update or install the Clean Air in Cities App Version 2.2 or later (same on App and Android). Please allow Settings -> Privacy -> Location Services -> On -> Location Access -> ‘While Using the App [or Widgets]’ if you have not already done so.
5. Two Clean Air in Cities Widgets are available for iphones. First, tap on the home screen or swipe left for the notification page. Second, tap the ‘+’ sign top left. Third, select the Clean Air in Cities (CleanAir) App which reveals the small widget immediately and offers the wide widget by swiping left. Fourth, ‘Add’ one or other widget. Fifth, repeat steps two to four to add more widgets for amending location later. Sixth, press ‘Done’ top right. Check that Settings -> Privacy -> Location Services -> ‘On’ -> Location Access is allowed ‘While Using the App or Widgets’ as above if the area does not appear within two or three minutes.
6. Two Clean Air in Cities widgets are available for ipads. First, swipe right on the main home screen to reach the notifications page. Second, tap the ‘+’ sign top left (i.e. short tap). Third, select the Clean Air in Cities (CleanAir) app which reveals the small widget immediately and offers the wide version by swiping left. Fourth, ‘Add’ one or other widget. Fifth, repeat steps two to four to add more widgets for amending location later. Sixth, press ‘Done’ top right. Check that Settings -> Privacy -> Location Services -> ‘On’ -> Location Access is allowed ‘While Using the App or Widgets’ as above if the area does not appear within two or three minutes.
7. We recommend installing two or three small Widgets and two or three wide Widgets – with one on your home screen and the others on another screen of your device. We use small and wide Widgets for Current Location, Our Local Area, London and England.
8. Tapping briefly on the installed Widget opens the Clean Air in Cities app i.e. the App not the Widget. To edit the Widget, first tap and hold the widget (i.e. long tap) to reveal a pop-up menu offering ‘Edit Widget’, ‘Edit Home Screen’ and ‘Remove Widget’. Second, select ‘Edit Widget’ to search and select your current location or any one local area, region or England as a whole for reporting in the widget. Third, select or change an existing area, by tapping on the named area (highlighted in blue) to reveal the search page and select your area. Fourth, tap the background of your device to confirm the new area i.e. the screen outside the Widget.
9. We recommend keeping a ‘Current location’ version of the Widget on the home screen of your device. This allows you to see local statistics as you travel around England. You can allow ‘Location access’: ‘While Using the App or Widgets’; ‘While using the App’; ‘Ask Next Time’; or ‘Never’. We do not track identifiable data on individuals. We also recommend keeping other versions of the Widget, small and/or wide versions for your local area, region and England as a whole on a separate page of your device or the notifications page. If Location Services is turned off, any Widgets using that functionality will show a stroke through the location pin (i.e. top left of the widget). The stroke will disappear when Location Services is turned on again.
10. Better still, ios devices let you create a ‘Stack’ on your homepage of several small Clean Air in Cities Widgets (or wide ones) and re-order them. This allows you to have (say) four Widgets on top of each other: 1. Current location; 2. Westminster; 3. London; and 4. England. You can reorder them in edit, scroll through them and have everything you need in the space of one small (or wide) Widget! Amazing.
11. Two Clean Air in Cities Widgets are available for Android phones and tablets in light and dark variants to suit your preference. First, touch and hold an empty space on your Home screen. Second, tap ‘Widgets’ on the popup menu that appears. Third, scroll down the list of available widgets to find ‘Clean Air in Cities (CleanAir)’ app. Fourth, tap and hold the widget variant you would like to add and then drag it onto the available space on your Home screen. Fifth, select your current location or any one local area, region or England as a whole from the list to be shown in the widget. If you selected current location, you will be prompted to grant location permission which is required for the widget to determine local area as you travel around England. Finally, repeat all the steps above to add more widgets to your Home screen.
12. There are now six Clean Air in Cities Widgets – two small, two wide and two tall with counters or news updates. Ideas welcomed!
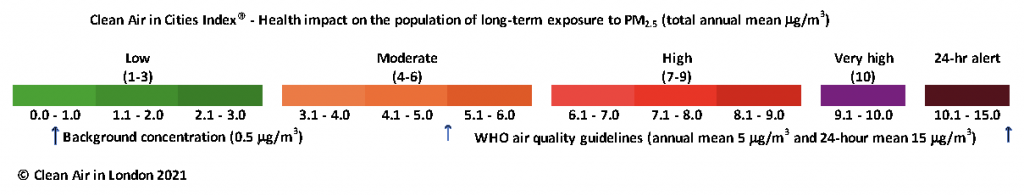
3. Background to the Clean Air in Cities Index®
The World Health Organisation (WHO) has ‘guidelines’ for human exposure to different forms of air pollution. They chose deliberately not to call them standards, limits or recommendations because there is known ‘safe’ level for exposure to fine particle air pollution (PM2.5).
https://www.who.int/en/news-room/fact-sheets/detail/ambient-(outdoor)-air-quality-and-health
Further, while concentrations for short-term exposure to PM2.5 have been colour-coded in bands for many years, Clean Air in London was the first, to our knowledge, to propose a colour-coded banding for long-term exposure to PM2.5.
Clean Air in London will keep its colour bandings under review because scientists have confirmed health effects of air pollution at lower concentrations of PM2.5. This evidence may lead to the WHO reducing its guidelines when they are published in 2021.
The ‘Clean Air in Cities Index’ is also trademarked as the Birkett Index. This was done to maintain high standards for its use.
Clean Air in London®, Clean Air in Cities Index® and Birkett Index® are registered trademarks of Clean Air in London:
https://www.gov.uk/search-for-trademark
4. Clean Air in London articles about the health impacts of air pollution
For more details on the ‘Clean Air in Cities Index’ and the short and long-term health impacts of air pollution:
https://cleanair.london/health/clean-air-in-cities-index/
5. Background to the health impacts
Public Health England report titled ‘Estimating Local Mortality Burdens associated with Particulate Air Pollution’ (April 2014):
Defra publishes the anthropogenic (human-made), non-anthropogenic (e.g. volcanic dust and sea salt) and total population-weighted concentrations of PM2.5. Non-anthropogenic levels are the residual after Defra’s modelling has identified individual sources of PM2.5. In recent years for England, it has been:
0.61 mg/m3 in 2020 (of 7.54 mg/m3 total)
0.53 mg/m3 in 2019 (of 9.57 mg/m3 total)
0.44 mg/m3 in 2018 (of 9.52 mg/m3 total)
0.51 mg/m3 in 2017 (of 9.41 mg/m3 total)
0.54 mg/m3 in 2016 (of 9.99 mg/m3 total)
1.12 mg/m3 in 2015 (of 9.42 mg/m3 total)
2.11 mg/m3 in 2014 (of 11.17 mg/m3 total)
2.13 mg/m3 in 2013 (of 11.52 mg/m3 total)
2.11 mg/m3 in 2012 (of 11.11 mg/m3 in total)
2.64 mg/m3 in 2011 (of 12.09 mg/m3 total)
6. Annual updates
Updates to the App and Widgets are usually released annually after Defra, Public Health England and the Office of National Statistics update their annual data. This new data includes:
1. Defra data for population-weighted annual mean PM2.5 (scroll down towards foot of webpage):
https://uk-air.defra.gov.uk/data/pcm-data
2. Public Health Indicator ‘D01 – Fraction of mortality attributable to particulate air pollution’:
The local area and regional data can be exported as a CSV file.
3. Office for National Statistics – Deaths registered by area of usual residence, UK:
4. Add the ONS’s City of London deaths (e.g. 38 in 2020) to Hackney’s total since Defra lumps the two areas together.
5. Update the master table sorted in region and then alphabetical order.
6. Check the ‘About’ (e.g. new year e.g. 2020), ‘Terms and conditions’ and ‘Privacy’ pages.
7. Check links and webpages used by the App and Widgets and legalise e.g. Terms and conditions and Privacy.
8. Consider updating some health text e.g. latest London or national estimates of deaths. Explain emissions, concentrations, exposures, impacts and outcomes. Also rankings?
9. Update App link on Facebook.
10. Test the Apple and Android versions of the App and Widgets before release.
7. Other useful resources
CAL-295-PHE-estimates-of-PM2.5-local-mortality-2010-1
Copy of CAIC app 2018 update_Final 060720
CAL-098-Mayors-health-study-report-June-2010
popwmpm252018byUKlocalauthority
popwmpm252018byEnglandregionanduppertierlocalauthority
popwmpm252019byEnglandregionanduppertierlocalauthority
popwmpm252019byUKlocalauthority
https://uk-air.defra.gov.uk/data/pcm-data
https://uk-air.defra.gov.uk/data/gis-mapping/
Updated 9 October 2021