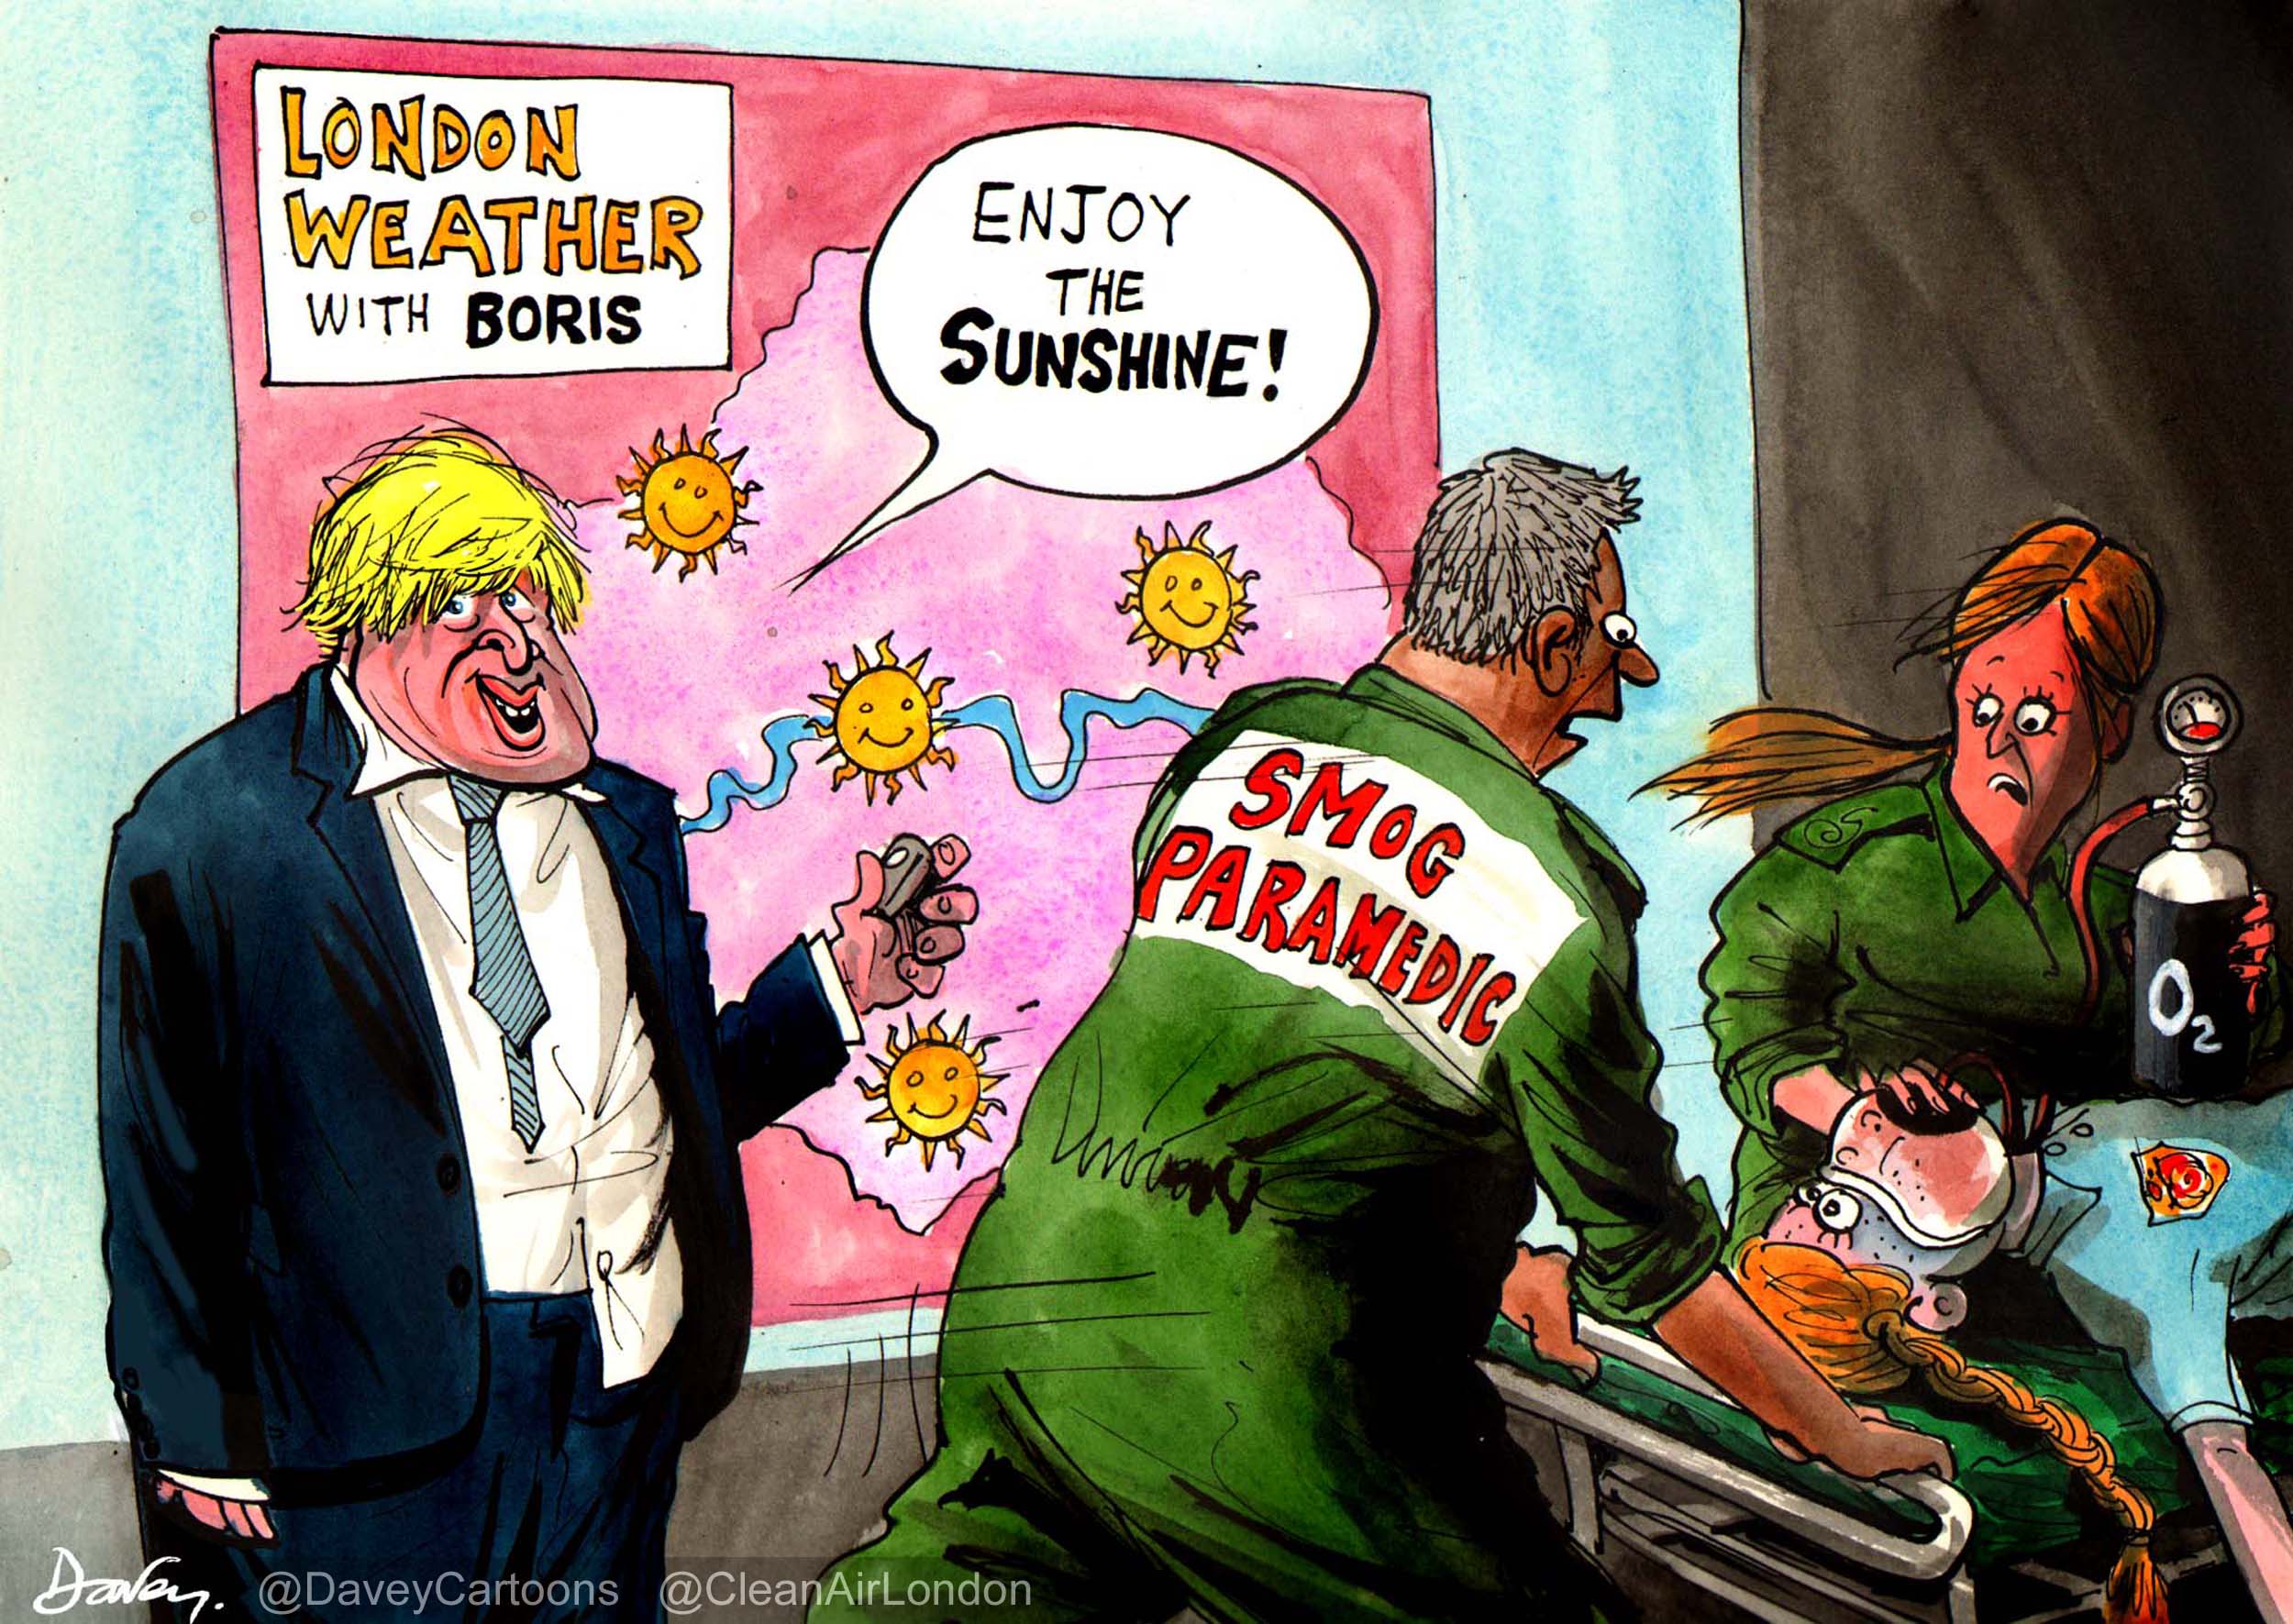
Long-term exposure to air pollution may have contributed to all 15,800 deaths due to cardiovascular causes in London in 2009 (i.e. one in three of all deaths) at an average additional loss of life for each of these adults of some three years at typical ages (e.g. 15% below age 65)
New scientific research indicates that children exposed to higher levels of traffic-related air pollution at school and home are at increased risk of developing asthma
Scientists say living near roads travelled by 10,000 or more vehicles per day could be responsible for some 15-30 per cent of all new cases of asthma in children; and of COPD (chronic obstructive pulmonary disease) and CHD (coronary heart disease) in adults 65 years of age and older
Clean Air in London has found 1,148 schools in London within 150 metres of roads carrying 10,000 or more vehicles per day and a total of 2,270 schools within 400 metres of such roads
Note: This Campaign Update is based largely on Clean Air in London’s submission dated 30 May 2011 to Parliament’s Environmental Audit Committee inquiry ‘Air Quality: a follow up report’
Groundbreaking research highlights health impacts of air pollution
Two groundbreaking recent scientific reports have highlighted the health impacts of air pollution on young people and the elderly. The first report was published by European scientists as part of the Aphekom project on 2 March and the second was published by the Committee on the Medical Effects of Air Pollutants (COMEAP) on 21 December last year. See:
http://www.aphekom.org/web/aphekom.org/home
Clean Air in London has highlighted its concerns for the health of Londoners, arising particularly from these reports, in its submission dated 30 May to Parliament’s Environmental Audit Committee and at the cross-party ‘Air Pollution and Health’ seminar organised by Darren Johnson AM (Green) on 20 June.
Quotes
Simon Birkett, Founder and Director of Clean Air in London (CAL), said:
“The Mayor of London told us last June that, using the language used for alcoholism, obesity and smoking, an estimated 4,267 deaths in London in 2008 were attributable to long-term exposure to dangerous airborne particles (PM2.5).
“Groundbreaking recent research by COMEAP on how to express the mortality effects of air pollution has shown us that the average loss of life for these 4,267 people was about 11.5 years. We know too the Mayor’s estimate will have been calculated after eliminating the effect of dozens of other possible risk factors (e.g. educational status as a surrogate for income and smoking) to produce a pure number assuming air pollution is the sole cause of those deaths.
“The estimate of 4,267 extra or excess deaths is a good one for comparing the effects of air pollution with the effects of other causes such as alcohol, active or passive smoking, obesity, diet etc which are calculated in the same way. However, COMEAP has shown us that because, in practice, individuals experience multiple risks, including air pollution, almost certainly air pollution played some part in shortening the life of a much larger number of individuals in London. It is not possible to estimate that number reliably but given that much of the impact of air pollution on mortality is linked to cardiovascular deaths, it is more reasonable to consider that air pollution may have contributed to all 15,800 deaths due to cardiovascular causes in London [in 2009] (i.e. one in three of all deaths) at an average additional loss of life for these people of some three years (at typical ages for cardiovascular deaths e.g. 15% of which are before age 65).
“Separate scientific research published recently by the Aphekom group of scientists has shown that those living near roads travelled by 10,000 or more vehicles per day on average could be responsible for some 15-30 per cent of all new cases of asthma in children; and of COPD (chronic obstructive pulmonary disease) and CHD (coronary heart disease) in adults 65 years of age and older. The same study further estimated that, on average for all 10 cities studied, 15-30 per cent of exacerbations of asthma in children, acute worsening of COPD and acute CHD problems are attributable to air pollution. This burden is substantially larger than previous estimates of exacerbations of chronic diseases, since it has been ignored so far that air pollution may cause the underlying disease as well. Related research indicates that associations of asthma with traffic-related pollution from nearby sources at schools were independent of estimated effects of exposures at homes.
“Clean Air in London (CAL) has looked at the implications for London of this groundbreaking recent research into the effects of air pollution on public health. For the first time, research is telling us that traffic-related air pollution can cause asthma in young people and may have contributed to all 15,800 deaths due to cardiovascular causes in London [in 2009] (e.g. heart attacks and strokes but one in three of all deaths) at an average additional loss of life for these adults of some three years. After a Freedom of Information request to Transport for London, CAL has found 1,148 schools in London within 150 metres of roads carrying over 10,000 vehicles per day and a total of 2,270 within 400 metres of such roads.
“The Government and Mayor Johnson must tackle an invisible public health crisis harming as many people now as we thought during the Great Smog in December 1952. We need: one or more additional inner low emission zones that ban the oldest diesel vehicles from our most polluted roads; and a massive campaign to build public understanding of the dangers of air pollution with advice on how people can protect themselves (i.e. adaptation) and reduce air pollution for themselves and others (i.e. mitigation).
“In this context, it is ridiculous of the Government to be saying it can’t comply with air quality laws in London until 2025. Even the ‘backward stepping’ Mayor has said it could be done by January 2015.”
Introduction and Summary to EAC submission
1. Clean Air in London (CAL) submits this memorandum dated 30 May 2011 to the Environment Audit Committee’s (EAC’s) inquiry ‘Air Quality: a follow up report’ which opened on 11 May and closes on 3 June 2011. Thank you for the opportunity for do so. The EAC’s announcement of the inquiry can be seen at:
2. CAL’s mission is to achieve urgently and sustainably at least World Health Organisation (WHO) recommended standards of air quality throughout London. CAL is a non-profit company limited by guarantee, registered in England and Wales, with number 7413769. It is responsible for the Campaign for Clean Air in London. Further details about CAL and its supporters can be found at cleanair.london.
3. After liaising with other environmental organisations planning to submit evidence to this EAC inquiry, CAL has decided to submit evidence only on the health impacts of air pollution. CAL has not repeated here information in its submission dated 13 December 2009 to the EAC’s earlier inquiry into Air Quality. However, it asks the EAC to consider again its recommendations in that submission as the new Government has failed substantially to act on them.
4. Clean Air in London has urged the EAC to consider whether the Government is acting in good faith on air quality laws including the: monitoring of air pollution; reporting to the European Commission; and keeping secret ministerial briefing papers relating to legal action. A new national Air Quality Strategy is needed and it should be prepared under the auspices or direct control of the Cabinet Office.
5. Using the same language used for alcoholism, obesity and smoking, the best estimate is that 4,267 deaths in London in 2008 were attributable to long-term exposure to anthropogenic and non- anthropogenic fine particles (PM2.5) at an average loss of life for these people of 11.5 years.
6. Following the clarifications in COMEAP’s (Committee on the Medical Effects of Air Pollutants) ground breaking and excellent recent (2010) report on how to express the mortality effects of air pollution, CAL proposes new phrasing to improve the communication of public health risks in general and air pollution in particular. In essence, the estimate of 4,267 deaths in London in 2008 attributable to long-term exposure to PM2.5 at an average loss of life of 11.5 years is calculated after eliminating the effect of dozens of other possible risk factors (e.g. educational status as a surrogate for income and smoking) to produce a pure number assuming air pollution is the sole cause of those deaths.
7. The estimate of 4,267 extra or excess deaths is a good one for comparing the effects of air pollution with the effects of other causes such as alcohol, active or passive smoking, obesity, diet etc which are calculated in the same way. However, because in practice individuals experience multiple risks, including air pollution, almost certainly air pollution played some part in shortening the life of a much larger number of individuals in London. It is not possible to estimate that number reliably but given that much of the impact of air pollution on mortality is linked to cardiovascular deaths, it is more reasonable to consider that air pollution may have contributed to all 15,800 deaths due to cardiovascular causes in London [in 2009] (i.e. one in three of all deaths) at an average additional loss of life for these people of some three years (at typical ages for cardiovascular deaths e.g. 15% of which are before age 65).
8. World Health Organisation (WHO) guidelines and UK and European legal standards have always addressed exposures and health effects of individual pollutants or indicators (such as PM10 mass, an indicator of a complex pollution mixture with multiple sources). Achieving guideline concentrations for individual pollutants, such as NO2, may therefore bring health benefits that exceed those anticipated on the basis of estimates of a single pollutant’s toxicity. London has the highest annual mean concentrations of NO2 of any capital city in the EU27. NO2 limit values and deadlines must be complied with in full.
9. Scientific research published since the EAC’s last inquiry into air quality has shown that those living near roads travelled by 10,000 or more vehicles per day on average could be responsible for some 15-30 per cent of all new cases of asthma in children; and of COPD (chronic obstructive pulmonary disease) and CHD (coronary heart disease) in adults 65 years of age and older. The same study further estimated that, on average for all 10 cities studied, 15-30 per cent of exacerbations of asthma in children, acute worsening of COPD and acute CHD problems are attributable to air pollution. This burden is substantially larger than previous estimates of exacerbations of chronic diseases, since it has been ignored so far that air pollution may cause the underlying disease as well. Related research indicates that associations of asthma with traffic-related pollution from nearby sources at schools were independent of estimated effects of exposures at homes. CAL has found 1,148 schools in London within 150 metres of such roads and a total of 2,270 within 400 metres.
10. Action must be taken urgently to protect those near living or attending school near the busiest roads. The Government must launch within weeks a massive campaign to build public understanding of the dangers of air pollution with advice on how people can protect themselves (i.e. adaptation) and reduce air pollution for themselves and others (i.e. mitigation).
11. We need the Government and Mayor Johnson to play their part in tackling an invisible public health crisis with as many early deaths attributable to air pollution in London in 2008 as we thought occurred during the Great Smog in 1952 (i.e. 4,267 compared to 4,075). This action must ensure full compliance with air quality laws throughout the UK.
12. CAL has made eight recommendations to the EAC at the end of this submission.
Impact on health from particulate matter and nitrogen dioxide pollution and how they should be measured and communicated
Warning: CAL has a lay understanding of epidemiology but has made every reasonable effort to ensure the accuracy of its statements on health risks.
Public health risks including alcoholism, obesity and smoking
13. This section gives an overview of well publicised public health risks such as alcoholism, obesity, road traffic deaths and smoking.
14. “During the 20th century, the health and life expectancy of persons residing in the United States (US) has improved dramatically. Since 1900, the average lifespan of persons in the United States has lengthened by over 30 years; 25 years of this gain were attributable to advances in public health.” Source: The Centers for Disease Control and Prevention in an article published in The Journal of the American Medical Association in 1999. See:
http://jama.ama-assn.org/content/281/16/1481.full
15. CAL wonders why so much money is spent on pursuing medical advances relative to basic improvements in public health e.g. air quality.
16. “Public health experts agree that environmental risks constitute 25% of the burden of disease.” Source: World Health Organisation, 2011.
17. “There are between 15,000 and 22,000 alcohol-related deaths every year in England. Most of these deaths are premature: on average, every man in this group loses 20 and every woman 15 years of life compared with the average.” Source: Department of Health, June 2008.
18. “Obesity is responsible for 9,000 premature deaths each year in England, and reduces life expectancy by, on average, 9 years.” Department of Health, September 2007
19. “Smoking is responsible for 87,000 deaths in England each year.” Department of Health, December 2008. “Men who quit smoking by 30 add 10 years to their life.” Source: NHS, July 2010
20. 2,222 people were killed in road traffic accidents in Great Britain in 2009. Source: Department for Transport, 2010.
21. The public health impact for alcoholism, obesity, road traffic deaths and smoking has been well publicised and addressed by massive media campaigns. A massive campaign to build public understanding of the dangers of poor air quality with advice on adaptation and mitigation. It should be similar in scale to those for alcoholism or smoking i.e. public health risks of similar quantum.
An introduction by CAL to environmental epidemiology
22. There are several ambient air pollutants including: nitrogen dioxide (NO2); tropospheric ozone (O3); particulate matter (ultrafine i.e. PM0.1; fine i.e. PM2.5; coarse i.e. PM2.5-10; and i.e. PM10); sulphur dioxide (SO2); and others (e.g. benzene). The WHO has found no safe level of human exposure to O3 or PM. In CAL’s experience, NO2 is often confused by commentators with oxides of nitrogen (NOx) or nitrous oxide (N2O a.k.a. laughing gas).
23. Ambient air pollutants cause and/or exacerbate mortality (early death) and morbidity (illness) and their effects can be acute (i.e. short-term) and/or chronic (long-term).
24. Size matters since smaller particles penetrate deeper into the lungs and bloodstream. Toxicity matters also so we must be concerned too about larger particles e.g. coarse particles such as PM2.5-10.
25. Time scale matters. The impact of short-term exposure to air pollution is typically assessed through ‘time series’ studies whereas the impact of long-term exposure requires ‘cohort’ studies. The health impact of long-term exposure to air pollution is up to 10 times greater than for short-term exposure.
26. There is an unknown degree of overlap between the health impact of different ambient air pollutants and short and long-term exposure.
27. Air pollution can be ‘man-made’ (i.e. anthropogenic) or ‘background’ (i.e. non-anthropogenic). Concentration response functions (CRF a.k.a. hazard rates or relative risks) used for estimating the number of deaths attributable to changes in exposure to air pollution typically use total air pollution (i.e. anthropogenic and non-anthropogenic). CRFs can be used to assess impact on total mortality and/or type of mortality (e.g. cardiopulmonary and lung cancer). CRFs usually include a central or ‘best’ estimate and a range. CRFs exist for short-term exposure (e.g. hourly or daily mean) and long- term exposure (e.g. annual mean).
28. CRFs for long-term exposure to PM2.5 are non-linear and assess the impact on those aged 30 and above. Children do not usually appear in mortality statistics for air pollution but do appear in those for other consequences of exposure to air pollution e.g. reduced lung size.
29. Metrics used for describing the impact of air pollution on public health include: attributable (or premature, extra or excess) deaths; years (of life) lost for the total population; average years (of life) lost per statistical victim (e.g. 11.5 years); and average for the total population (e.g. six months). They should be tied to an individual year e.g. ‘in 2008’ to take account of year to year changes in air pollution and death rates.
Health impacts attributable to short-term exposure to air pollution
30. COMEAP published a report titled ‘Quantification of the Effects of Air Pollution on Health in the United Kingdom’ on the health impact of short term exposure to PM10 in 1998. This reviewed time series studies and took as the relevant CRF an increase of 0.75% in mortality (i.e. attributable deaths) per 10 microgram per cubic metre (μg/m3) increase in PM10 as a 24-hour mean. COMEAP estimated a total of 8,100 deaths ‘brought forward’ due to PM10 annually among total deaths in urban Great Britain (based on 1995 and 1996 air pollution levels). See:
http://comeap.org.uk/images/stories/Documents/Reports/quantification%20report%201998.pdf
31. The same COMEAP report referred to 3,500 deaths brought forward per year by SO2 in urban areas of GB and between 700 and 12,500 deaths brought forward by O3 in both urban and rural GB during the summer only. CRFs were included for those risks too. Ministers, commentators and others have therefore estimated and referred, including as recently as late 2009, to there being 12,300 and 24,100 deaths ‘brought forward’ (or ‘up to 24,000 deaths’) annually in the UK due to air pollution. Of course, given the unknown overlap between effects, the correct range for all these short-term effects is 8,100 to 24,100.
Health impacts attributable to long-term exposure to PM2.5
32. COMEAP published a ground breaking and excellent report on 21 December 2010 on how to express the mortality effects of air pollution titled ‘The Mortality Effects of Long-Term Exposure to Particulate Air Pollution in the United Kingdom’. See:
2009 Report:
33. COMEAP was asked to answer in its 2010 report “If anthropogenic air pollution in 2008 were to be removed and pollution sustained at low non-anthropogenic levels, what would be the benefits in terms of effects on mortality?”
34. COMEAP concluded “The current (2008) burden of anthropogenic particulate matter air pollution is, with some simplifying assumptions, an effect on mortality in 2008 equivalent to nearly 29,000 deaths in the UK at typical ages and an associated loss of total population life of 340,000 life-years. The burden can also be represented as a loss of life expectancy from birth of approximately six months. The uncertainties in these estimates need to be recognised: they could vary from about a sixth to double the figures shown.” See paragraph 2 on pages 1 and 2.
35. COMEAP went on to say “It is not known how this population-wide burden is spread across individuals in the population, but we can speculate between various possibilities. Our results are consistent with an average loss of life ranging at one extreme from 11 ½ years if air pollution was solely responsible for 29,000 deaths to, at the other extreme, six months if the timing of all deaths was influenced by air pollution. We believe both of these extremes to be extremely unlikely. Given that much of the impact of air pollution on mortality is linked to cardiovascular deaths, it is more reasonable to consider that air pollution may have made some contribution to the earlier deaths of up to 200,000 people in 2008, with an average loss of life of about two years per death affected, though that actual amount would vary between individuals. However, this assumption remains speculative.” See paragraph 21 on page 5.
36. CAL understands that the figure of 200,000 was based on there being 190,857 deaths at all ages in 2008 due to all diseases of the circulatory system (including coronary heart disease (88,236), stroke (43,142) and other diseases of the circulatory system (59,479)) in the United Kingdom. There were 579,677 deaths in total from all causes in the United Kingdom in that year.
36. COMEAP used an annual mean population-weighted anthropogenic PM2.5 for the UK in 2008 of 8.97 μg/m3 (based on a total of 10.39 μg/m3 and non-anthropogenic of 1.42 μg/m3). Defra’s Air Quality Strategy 2007 estimated annual mean population-weighted anthropogenic PM2.5 in the UK in 2005 was 10.144 μg/m3 (gravimetric) (based on non-anthropogenic PM2.5 in 2005 of 3.37 μg/m3).
37. Based on the latest COMEAP advice, CAL estimates there were between 29,000 and 53,100 deaths in the UK attributable to anthropogenic air pollution in 2008 assuming either full or no overlap respectively between the health impacts of short and long-term exposure to different ambient air pollutants.
London health impacts attributable to long-term exposure to PM2.5
Strategy “around 4,300 deaths per year in London are partly caused by long-term exposure to PM 2.5”
38. The Mayor’s Air Quality Strategy says that road transport is the main source of PM2.5 emissions in London, contributing 80% in 2008 (and 79% of PM10 in Central London) (pages 38 to 41). The Department for Transport has said that road transport is responsible for up to 80% of NO2 in large urban areas.
39. On 29 June 2010, the Mayor of London published a report titled ‘Report on estimation of mortality impacts of particulate air pollution in London’. It estimated there were 4,267 deaths in Greater London in 2008 attributable to long-term exposure to anthropogenic and non-anthropogenic PM2.5 with a range of 756 to 7,965. The calculations were based on annual mean concentrations of PM2.5 in London in 2006 and mortality in London in 2008, both by ward. The Mayor of London has shown an inadequate understanding of the impact and the excellent health study by saying in his Air Quality [CAL emphasis]. The full health study by the Institute of Occupational Medicine can be seen at:
http://www.london.gov.uk/sites/default/files/Health_Study_%20Report.pdf
40. CAL aggregated the ward statistics to calculate totals by borough. These can be seen at:
Provisional analysis by borough
42. There were 15,816 deaths in Greater London in 2009 due to diseases of the circulatory system out of a total of 48,155 deaths from all causes, at ages 28 days and over. See Table 2 from ‘Deaths: numbers by age, sex and selected underlying cause, 2009’ via:
http://www.ons.gov.uk/ons/dcp19975_260821.xml
44. Of the 15,816 deaths, the cumulative percentages of deaths by age band were: under 34 (0.7%); 35-44 (2.2%); 45-54 (6.0%); 55-64 (13.8%); 65-74 (28.5%); 75-84 (60.2%); and 85 and over (100%). These might be termed the typical ages for deaths attributable to diseases of the circulatory system.
45. Using its understanding of the approach adopted by COMEAP for the national calculations, CAL calculates that the average additional loss of life for cardiovascular deaths in London is calculated as (4,267 x 11.5)/15,816 = 3.1 years.
46. Borough by borough numbers for the number of early deaths due to heart attacks and strokes (i.e. not including ‘other diseases of the circulatory system’) in London in 2010 can be found at:
http://www.apho.org.uk/resource/view.aspx?RID=50215®ION=50156&SPEAR
Comparing health impacts during the Great Smog in 1952 and now
47. According the BBC, the Department of Health estimated there were 4,075 deaths attributable to short- term exposure to air pollution during the Great Smog in December 1952. The Environment Agency and the Met Office both also refer to 4,000 additional deaths during the Great Smog of 1952.
http://news.bbc.co.uk/1/hi/england/2545759.stm
48. We did not know in 1952 about the dangers of long-term exposure to air pollution. These impacts have only been known and quantified since the 1990s and later as a result of large cohort studies.
49. We need the Government and Mayor Johnson to play their part in tackling an invisible public health crisis with as many early deaths attributable to air pollution in London in 2008 as we thought occurred during the Great Smog in 1952 (i.e. 4,267 compared to 4,075).
Communicating the impact of long-term exposure to PM2.5
50. At the Care4Air conference in Sheffield on 22 September 2010 a survey was undertaken which showed 88.9% of attendees ‘Would like to see an estimate for the number of premature deaths due to long-term exposure to fine particles for [their] area (i.e. like London)’ and 93.3% of attendees ‘Would welcome official guidance on the careful interpretation of health impact metrics such as ‘premature deaths’ and ‘years of life lost’’.
51. Years of life lost (YLL) (or Disability Adjusted Life Years (DALYs) which are more commonly used in the United States) and its monetary equivalent are the best metrics for policy makers, economists and scientists to use to evaluate the health impact of measures to reduce air pollution (e.g. low emission zones). Clearly legal deadlines must also be met.
52. Using the same language used for alcoholism, obesity and smoking, the best estimate is that 4,267 deaths in London in 2008 were attributable to long-term exposure to anthropogenic and non- anthropogenic fine particles (PM2.5) at an average loss of life for these people of 11.5 years.
53. Following the clarifications in COMEAP’s ground breaking and excellent recent (2010) report on how to express the mortality effects of air pollution, CAL proposes new phrasing to improve the communication of public health risks in general and air pollution in particular. In essence, the estimate of 4,267 deaths in London in 2008 attributable to long-term exposure to PM2.5 at an average loss of life of 11.5 years is calculated after eliminating the effect of dozens of other possible risk factors (e.g. educational status as a surrogate for income and smoking) to produce a pure number assuming air pollution is the sole cause of those deaths.
54. The estimate of 4,267 extra or excess deaths is a good one for comparing the effects of air pollution with the effects of other causes such as alcohol, active or passive smoking, obesity, diet etc which are calculated in the same way. However, because in practice individuals experience multiple risks, including air pollution, almost certainly air pollution played some part in shortening the life of a much larger number of individuals in London. It is not possible to estimate that number reliably but given that much of the impact of air pollution on mortality is linked to cardiovascular deaths, it is more reasonable to consider that air pollution may have contributed to all 15,800 deaths due to cardiovascular causes in London [in 2009] (i.e. one in three of all deaths) at an average additional loss of life for these people of some three years (at typical ages for cardiovascular deaths e.g. 15% of which are before age 65).
Importance of nitrogen dioxide
55. An ‘Update of WHO air quality guidelines’ was published in February 2008. That confirmed the Air Quality Guideline (AQG) value for nitrogen dioxide (NO2) as an annual mean of 40 μg/m3 and a one hour mean of 200 µg/m3. It said “The AQG have always addresses exposures and health effects of individual pollutants or indicators (such as PM10 mass, an indicator of a complex pollution mixture with multiple sources). However, as understanding of the complexity of the air pollution mixture has improved, the limitations of controlling air pollution and its risk through guidelines for single pollutants have become increasingly apparent. Nitrogen dioxide (NO2) for example is a product of combustion processes and is generally found in the atmosphere in close association with other primary pollutants, including ultrafine particles. It is itself toxic and is a precursor of ozone, with which it coexists along with a number of other photochemically generated oxidants. Concentrations of NO2 are often strongly correlated with those of other toxic pollutants. Its concentration is readily measured but needs interpretation as a potential surrogate for a set of sources and the resulting mixture. Achieving guideline concentrations for individual pollutants, such as NO2, may therefore bring health benefits that exceed those anticipated on the basis of estimates of a single pollutant’s toxicity.” See:
http://www.springerlink.com/content/943153q7637737t0/fulltext.pdf
56. CAL urges the EAC to reject any suggestion from the Government that the NO2 limit values, which are the same as the AQG values above except that the former allow 18 hours over 200 μg/m3 in a year instead of being an ‘absolute’ level, are not important for the protection of human health.
Increased health risks for those living or attending school within 150 metres of busy roads
57. CAL participated in the final stakeholder meeting of the Aphekom project on 2 March 2011. At that meeting the results of work by 60 scientists in 12 European cities over three years was presented and discussed. See:
http://www.aphekom.org/web/aphekom.org/home
58. Aphekom determined that, on average, over 50% of the population in the 10 European cities studied lives within 150 metres of roads travelled by 10,000 or more vehicles per day and could thus be exposed to substantial levels of toxic pollutants. In the cities studied, the Aphekom Health Impact Assessment showed that those living near these roads could be responsible for some 15-30 per cent of all new cases of asthma in children; and of COPD (chronic obstructive pulmonary disease) and CHD (coronary heart disease) in adults 65 years of age and older. Aphekom further estimated that, on average for all 10 cities studied, 15-30 per cent of exacerbations of asthma in children, acute worsening of COPD and acute CHD problems are attributable to air pollution. This burden is substantially larger than previous estimates of exacerbations of chronic diseases, since it has been ignored so far that air pollution may cause the underlying disease as well.
59. In addition, for the population studied Aphekom estimated an economic burden of more than Euro 300 million every year attributable to chronic diseases caused by living near heavy traffic. This burden is added to some Euro 10 million attributable to exacerbations of these diseases. Aphekom went on to comment “Our work suggests the total benefits of reducing traffic exposure for urban populations may have been largely underestimated until now”.
60. The Aphekom team highlighted new evidence from the United States published in a scientific study titled ‘Childhood Incident Asthma and Traffic-Related Air Pollution at Home and School’ (Rob McConnell et al in ‘Environmental Health Perspectives’ on 6 April 2010). The study was unique in its prospective assessment of the relationship of new-onset childhood asthma to community regional air pollution and near-source traffic-related exposure at home and in a large number of schools. The results indicate that associations of asthma with traffic-related pollution from nearby sources at schools were independent of estimated effects of exposures at homes.
61. CAL submitted an information request to Transport for London (TfL) under the Environmental Information Regulations for details of schools within 150 metres of roads in London carrying over 10,000 vehicles per day on average. CAL also asked for details of those within 400 metres of such roads. TfL’s reply identified 1,148 schools within 150 metres and a total of 2,270 schools within 400 metres of these busy roads. The list of those schools is attached separately as evidence for the EAC.
62. CAL had previously obtained from TfL details of schools within 150 metres and 400 metres of roads carrying over 100,000 vehicles per day on average. TfL’s reply showed 13 schools within 150 metres and 75 in total within 400 metres of such roads. The list of schools is attached separately as evidence for the EAC.
63. CAL had requested the information about schools near roads carrying over 100,000 vehicles per day on average to inform its submission to the Examination in Public (EiP) for the Draft Replacement London Plan. In its submission to the EiP, CAL said “EU air quality laws highlight the need to protect ‘sensitive populations’ such as children and the elderly. Scientific research in the US has linked proximity to road traffic to lower lung growth in young children. Standards exist in the US to protect children at schools from harmful emissions (e.g. California Education Code Section 17213 which requires [broadly] that the governing body of a school district may not approve a project involving the acquisition of a schoolsite by a school district unless inter alia: strict assessments are made if the proposed schoolsite would be within one-fourth of a mile [c 400 metres] of a freeway or other busy traffic corridor, large agricultural operations or railyard; and for a schoolsite with a boundary that is within 500 feet [c150 metres] of the edge of the closest traffic lane of a freeway or other busy traffic corridor, the governing body of the school district determines, through analysis based on appropriate air dispersion modelling, and after considering any potential mitigation measures, that the air quality at the proposed site is such that neither short-term nor long-term exposure poses significant health risks to pupils. ‘Freeway or other busy traffic corridor’ is defined as ‘those roadways that, on an average day have traffic in excess of 50,000 vehicles in a rural area and 100,000 vehicles in an urban area’).”
Recommendations
64. CAL makes the following eight recommendations to the EAC.
65. Consider whether the Government is acting in good faith on air quality laws including the: monitoring of air pollution; reporting to the European Commission; and keeping secret ministerial briefing papers relating to legal action. CAL has previously written to the EAC on this subject.
66. Condemn the Government for still not publishing for consultation its draft time extension notification (TEN) for NO2 which must be consulted upon and submitted to the European Commission by 30 September 2011. This consultation has been ‘work in progress’ for well over two years and yet stakeholders seem set to be ‘bounced’ into a shortened, last minute, summer consultation. Perhaps as seriously, it seems the Government may be ‘playing games’ with the EAC by planning to publish the TEN just days after the closing date for evidence to be submitted to the EAC.
67. CAL reiterates the recommendations it submitted to the EAC in December 2009 since there is little or no evidence the Government has yet acted upon them.
68. Insist the Government publishes for every local authority in the UK an estimate of the number of deaths attributable to long-term exposure PM2.5 together with the number of deaths due to cardiovascular causes. These should: follow the form of the excellent report by the Institute for Occupational Medicine for London (i.e. including ranges); use the new phrasing recommended by CAL (see paragraphs 51 to 53 above); and be accompanied by careful guidance on the interpretation of these metrics provided recently by COMEAP.
69. The Government should be told to produce a new national Air Quality Strategy (AQS) as a matter of urgency. This should be done under the auspices or direct control of the Cabinet Office.
70. CAL urges the EAC to recommend a requirement under UK planning law to protect sensitive populations (e.g. children and the elderly) from air pollution. This should build upon the standards applying in California (see paragraph 62 above). The new AQS should address the need to monitor ultrafine particles.
71. The Government must commit to comply fully now with air quality laws. The coalition’s vision of ‘working towards’ such compliance is meaningless and the lack of appropriate targets in Defra’s Business Plan is a scandal.
72. Last but not least, the Government should launch immediately a massive campaign to build public understanding of the dangers of air pollution with advice on how people can protect themselves (i.e. adaptation) and reduce air pollution for themselves and others (i.e. mitigation). The build up to the 2012 Olympic and Paralympic Games offers a tremendous initial focus for such a campaign.
73. Government communications describing other public health risks should be improved to match that proposed now for air pollution and informed by the excellent recent COMEAP report on the subject.
CAL 139_75 schools within 150 and 400 metres of London roads carrying over 100,000 vpd_searchable
CAL 139_ London roads carrying over 10,000 vpd_alphabetical order and searchable
CAL 139_London roads carrying over 10,000 vpd_ranked by volume of traffic and searchable
CAL 139_London roads carrying over 100,000 vpd_ranked by volume of traffic and searchable
CAL 139 Safe routes to schools
Clean Air in London Builds Awareness of Aphekom’s Work 120912
BBC London television – Schools and traffic do not mix in the health stakes on 21 June 2011:
http://www.bbc.co.uk/news/uk-england-london-13863502
Green Party interactive map of the schools
http://www.jennyforlondon.org/schools/
Camden Council: Air pollution and schools
http://www.camden.gov.uk/ccm/content/environment/green/airquality/air-pollution-and-schools.en
LBC Radio 97.3 news on 27 February 2013
http://audioboo.fm/boos/1236065-mayor-s-office-keep-kids-indoors-on-smog-days#t=0m0s
LBC Radio 97.3: News on 27 February 2013
Sinphonie scientific research project