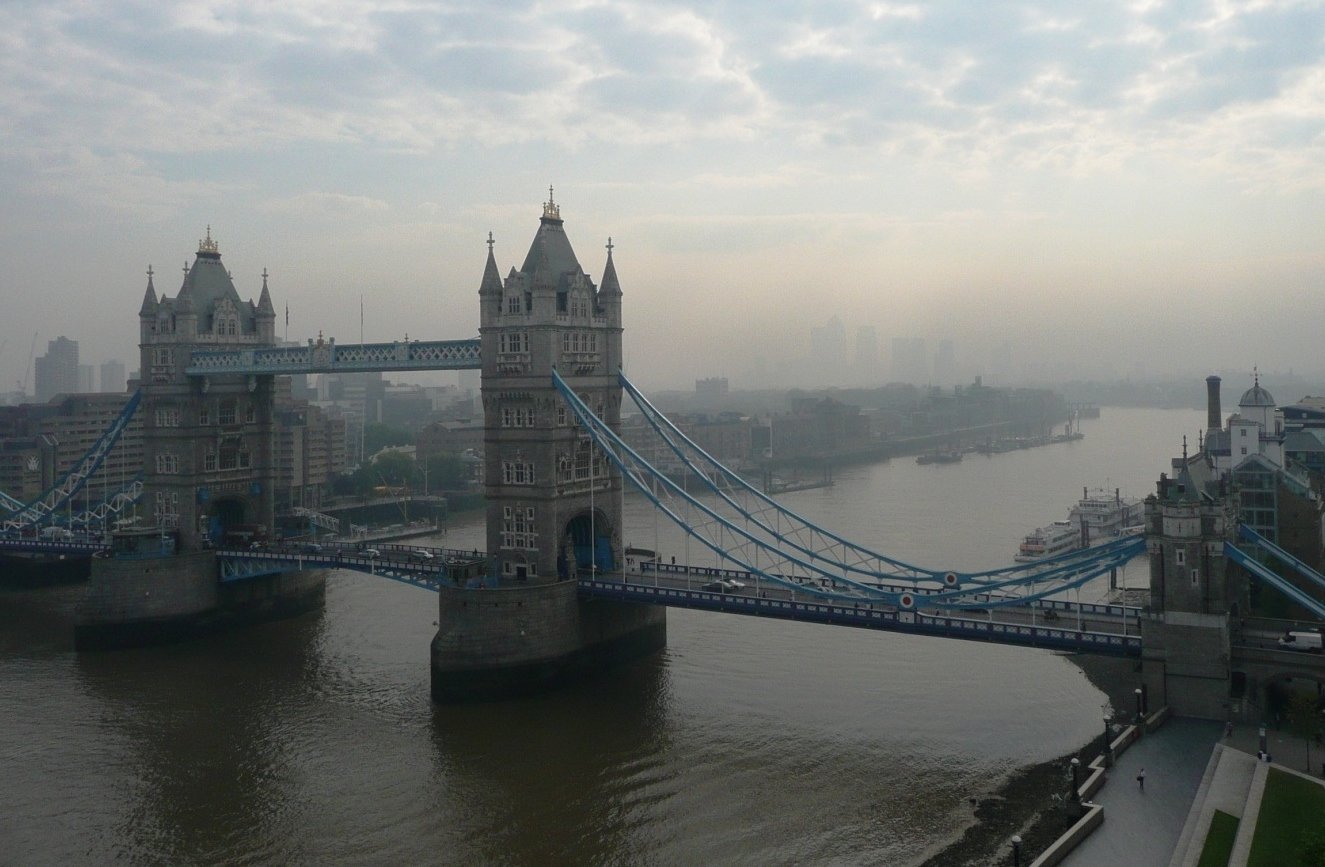
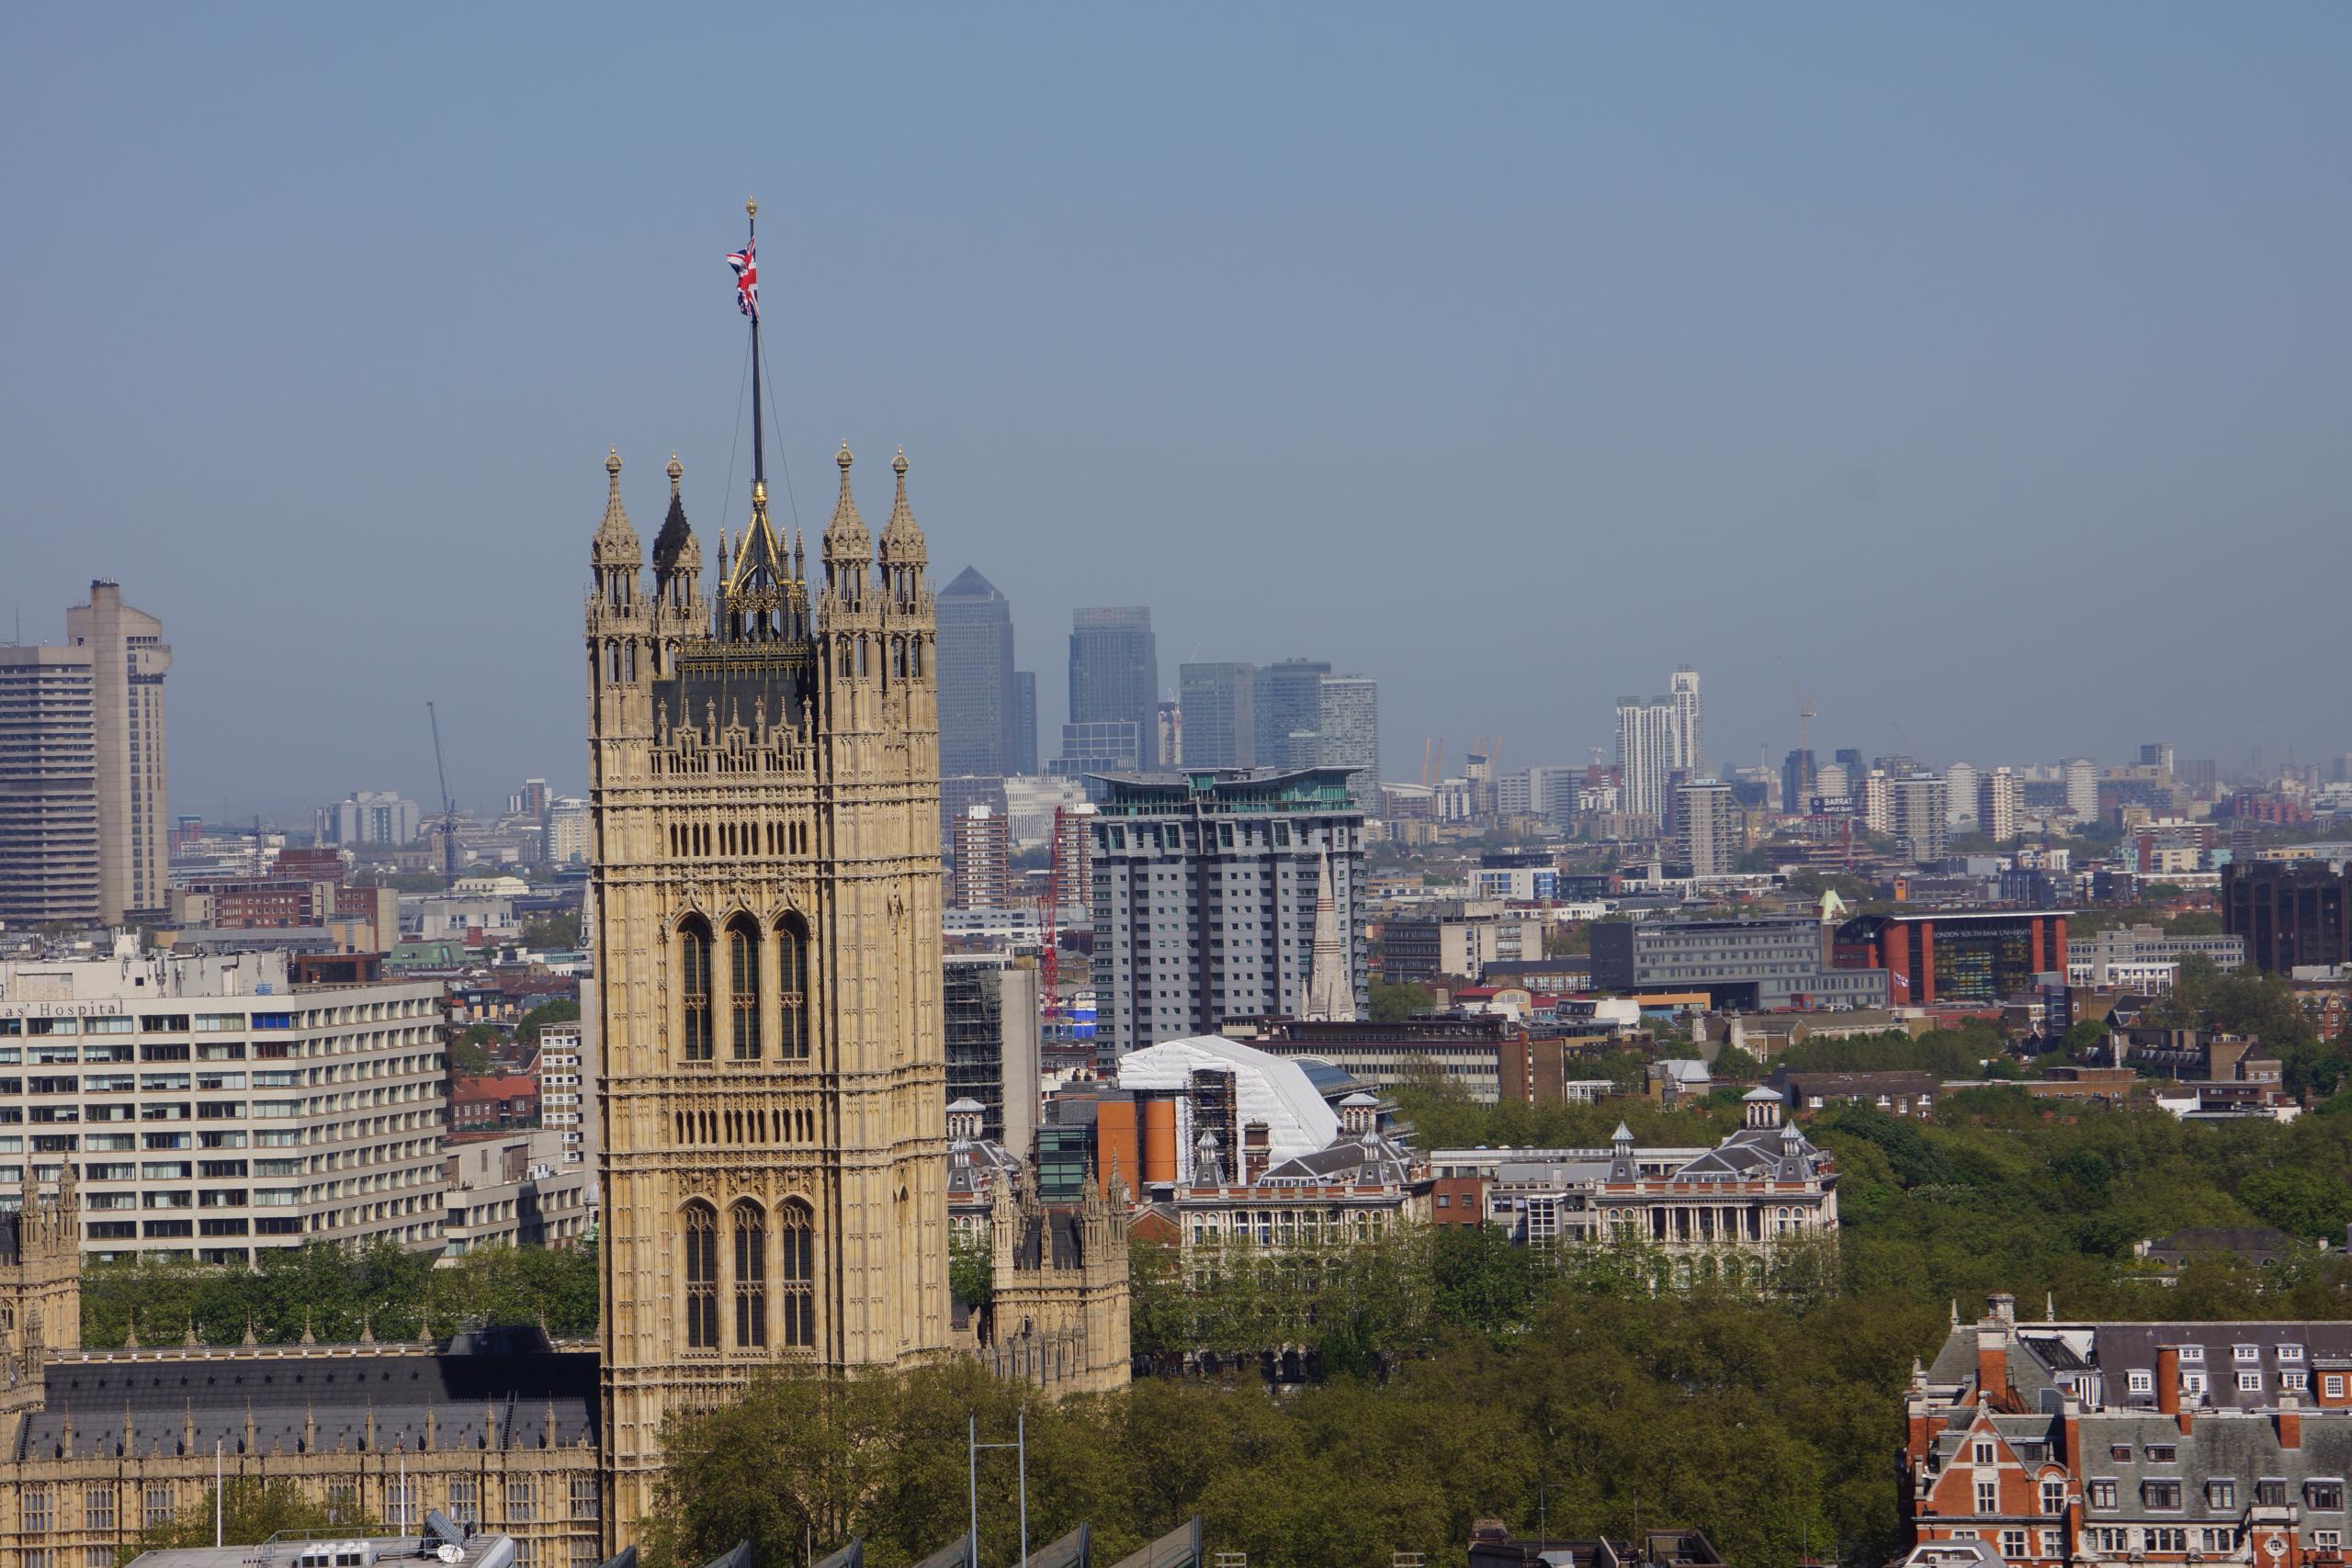
Government hid a number of ‘High’ air pollution events during the Olympics and Paralympic Games. Endurance athletes may have been affected. Government also hid a ‘High’ pollution episode in parts of the UK just days before the 60th anniversary of the Great Smog
Top scientists from ClearfLo have confirmed that a number of ‘High’ pollution events were observed during the London 2012 Olympics where meteorological conditions favoured sustained, elevated ozone production. ‘Pollution Checks’ by Clean Air in London showed ‘High’ particle number concentrations three times during the Olympic and Paralympic Games
Government has sought to ‘influence’ published forecasts by insisting: independent air quality forecasts must be ‘consistent’ with its own forecasts; and on its sole right to warn people. Instead, published forecasts should: be free from political interference; draw on the full range of scientific expertise; provide an overview of risk; mention particular risks; explain the nature of the forecast; and ensure the public is warned during smog episodes
‘Clean Air in London’ applauds the work done by forecasters such as the Met Office and urges them to extend their forecasts to include urban roads and promote their services
Clean Air in London (CAL) has conducted a six month investigation into the Government’s forecasting of air pollution during smog episodes.
The investigation included several Environmental Information Requests (which are similar to Freedom of Information requests). It focused particularly on the period up to and during the Olympic and Paralympic Games. The Government’s current air pollution forecasts can be seen at:
http://uk-air.defra.gov.uk/forecasting/
CAL’s investigation has uncovered extraordinary efforts by the Government to hide important information about air pollution from the public 60 years after the Great Smog Note 1, including before and during the Olympic and Paralympic Games. The London Air Quality Network shows there have been 11 smog episodes so far this year in London Note 2.
In a separate investigation, CAL analysed Met Office forecasts for the Olympic Park on the days between 1 July and 30 September 2012.
Quotes
Simon Birkett, Founder and Director of Clean Air in London, said:
“Again the Government has been found systematically hiding important information about air pollution. This time it’s the Government’s own air pollution forecasts and failure to issue a press release since 20 April 2011 to warn the public about smog episodes.
“Perhaps worse, the Government has sought to ‘influence’ published forecasts by insisting: independent air quality forecasts must be ‘consistent’ with its own forecasts; and on its sole right to warn people. Instead, published forecasts should: be free from political interference; draw on the full range of scientific expertise; provide an overview of risk; mention particular risks; explain the nature of the forecast; and ensure the public is warned during smog episodes.
“The Government’s efforts to keep modern air pollution ‘invisible’ take us back to the Great Smog when the Government denied the effects of ‘visible’ air pollution. When the Great Smog hit London 60 years ago we knew nothing of the many health impacts of air pollution that have only been identified in the last 10 years or so. The Mayor’s own estimate is 4,267 deaths attributable to long-term exposure to ‘invisible’ airborne particles in London in 2008 which compares with 4,075 due to short-term exposure to ‘visible’ air pollution in December 1952. Only smoking causes more early deaths.
“Levels of nitrogen dioxide, a toxic gas, in London are the highest of any capital city in Europe and more than twice legal limits, in force since January 2010, near our busiest streets. Even the Government has admitted that over 440,000 people in London in 2011 were exposed to levels of nitrogen dioxide exceeding the legal limit at background locations i.e. excluding exposures near busy roads.
“We need the Mayor to double his efforts so London leads the world in tackling air pollution as it did after the Great Smog. The most important single measure needed is to build public understanding of the dangers of air pollution with advice for people on protecting themselves and reducing pollution for themselves and others. The Mayor should defy the Government and start issuing press releases to warn the public during smog episodes. There have been 11 such episodes in London this year.
“Clean Air in London applauds the work done by forecasters such as the Met Office and urges them to extend their forecasts to include urban roads and promote their services more widely.
“Let’s hope the 60th anniversary of the Great Smog triggers the scale of change we saw then.”
Analysis
Key findings of the investigation have included:
- Government has not published a single press release to warn the public of smog since 20 April 2011 when doing so created front page news. This failure is despite the Government insisting that it wants to communicate the dangers of air pollution to the public and promising to Ben Bradshaw MP on 16 April 2012 that it would issue press releases at least annually;
- Government has sought systematically to ‘influence’ published air quality forecasts by insisting they must be ‘consistent’ with its own forecasts and on its sole right to warn people Note 3;
- top scientists have confirmed Note 4 that a number of ‘High’ pollution events were observed during the Olympics where meteorological conditions favoured sustained, elevated ozone production. ‘Pollution Checks’ by CAL showed ‘High’ particle number concentrations three times during the Olympic and Paralympic Games;
- Government’s descriptive forecasts have often been inconsistent with the facts particularly during smog episodes e.g. http://uk-air.defra.gov.uk/forecasting/; and
- Government hid a number of ‘High’ air pollution events during the Olympics and Paralympic Games. Endurance athletes may have been affected. The Government also hid a ‘High’ pollution episode in parts of the UK just days before the 60th anniversary of the Great Smog.
Top scientists confirm that ‘High’ pollution events were observed during the Olympics
Top scientists involved in the Clean Air for London project (ClearfLo), which is the largest and most comprehensive effort to measure air pollution in Britain, have submitted results to the American Geophysical Union conference which is taking place in San Francisco between 3 to 7 December 2012 Note 4. Information about ClearfLo can be seen at:
http://www.bbc.co.uk/news/science-environment-19180981
The results are described in an abstract for a poster session. Key findings include:
‘Summertime observations coincided with the London 2012 Olympics. During this observational period, a number of high pollution events were observed where meteorological conditions favoured sustained, elevated ozone production (peaking at 100 ppbv [parts per billion by volume])’.
The World Health Organisation guideline for human exposure to ozone is an eight hour average of 50 ppbv i.e. 100 micrograms per cubic metre.
Separate investigation into Met Office forecasts
In a separate investigation, CAL analysed Met Office forecasts for the Olympic Park on the days between 1 July and 30 September 2012.
The Met Office is the only organisation in the UK to publish five day forecasts for air quality. It forecasts regional or background levels of air pollution not urban roadside air pollution. Met Office forecasts are published also by the BBC.
http://www.metoffice.gov.uk/public/weather/forecast/?tab=fiveDay
and
http://www.bbc.co.uk/weather/2643743
CAL compared the Met Office’s forecasts to the Met Office’s own on-the-day forecasts. CAL found the Met Office impressively predicted correctly its own ‘on-the-day’ forecast on around 70% of days. However, CAL estimates the Met Office’s initial forecast (i.e. four days ahead) was about six times more likely to ‘under-forecast’ air pollution than ‘over-forecast’ it during that three month period.
CAL sought to compare the Met Office forecasts to actual outcomes for air pollution, since London experienced ‘High’ ozone and particle number concentrations during the Olympic and Paralympic Games. The Met Office has told CAL it ‘verifies on a rolling basis but does not have this information to hand for the unratified observations (although it can be regenerated)’.
Further details of the Met Office’s forecasts are set out in Note 4 below.
Notes
1. Great Smog between 5 and 9 December 1952
http://www.metoffice.gov.uk/education/teens/case-studies/great-smog
2. London Air Quality Network – 11 smog episodes so far this year in London
http://www.londonair.org.uk/london/asp/publicepisodes.asp?region=0
3. Clean Air in London media releases around the Olympic and Paralympic Games
‘Mayor of London urged to warn all those affected by smog’ on 24 July 2012
https://cleanair.london/olympics/mayor-of-london-urged-to-warn-those-affected-by-smog/
‘Government ‘Pollution Episode Warning’ on eve of Olympics Opening Ceremony’ on 25 July 2012
‘Government forecasts smog on eve of Closing Ceremony’ on 8 August 2012
https://cleanair.london/olympics/government-forecasts-smog-on-eve-of-olympics-closing-ceremony/
‘Clean Air in London calls for Paralympics Marathon to be delayed’ on 6 September 2012
https://cleanair.london/olympics/clean-air-in-london-calls-for-paralympics-marathon-to-be-delayed/
4. ‘Radical observations during the Clean air for London project’ (ClearfLo) presented to the American Geophysical Union
http://fallmeeting.agu.org/2012/eposters/eposter/a11b-0046/
“Low concentrations of radicals were observed during the wintertime, midday [OH], [HO2] and [RO2] were ~ 0.04, 0.8 and 1.5 pptv respectively, comparable to observations of radicals at other urban locations in winter, and which displayed a negative correlation with NO concentrations. OH reactivity was high and largely tracked the diurnal profiles of NOx and CO, with the highest reactivity ~100 s-1 observed during the morning rush hour. Analysis of factors controlling OH concentrations during the wintertime suggests that the formation of OH from the photolysis of O3 and subsequent reaction of O(1D) with H2O is a minor contribution both under high and low NOx conditions owing to the low rate of photolysis experienced and instead OH from photolysis of HONO (measured during ClearfLo using the LOPAP technique), ozonolysis of alkenes and the reaction of HO2 with NO dominated the oxidative capacity of this urban location. Summertime observations coincided with the London 2012 Olympics. During this observational period, a number of high pollution events were observed where meteorological conditions favoured sustained, elevated ozone production (peaking at 100 ppbv). Radical concentrations were elevated during these episodes, with [OH], [HO2] and [RO2] peaking at ~ 0.16, 14 and 10 pptv respectively.” CAL emphasis.
5. Met Office forecasts
As a result of requests under the Environmental Information Regulations and a meeting with senior Met Office officials, Clean Air in London understands that:
- Met Office forecasts are for locations (e.g. sports facilities) not monitoring sites. All roadside sites are excluded i.e. it is a regional or background only forecast;
- the Met Office verifies the forecasts at sites forming part of the Automatic Urban and Rural Monitoring Network (AURN), giving them an indication of the forecast error at these locations;
- the grid-point model has approximately 12 kilometre by 12 kilometre squares; there are eight AURN urban background stations within London which they verify against. The Met Office extracts forecast values at about 160 specific sites within London. A bilinear interpolation technique is used to derive the site specific values within grid-boxes. The AURN sites used include Bexley, Eltham, Harrow (Stanmore), Hillingdon, North Kensington, Teddington and Westminster;
- the Met Office computer calculates the COMEAP DAQI [Committee on the Medical Effects of Air Pollution’s Daily Air Quality Index] once a day at 11.30pm for each of the pollutants and time periods in the DAQI for each of five days ahead;
- the ‘worst’ result becomes the composite index for the following day;
- the forecasting of the DAQI is fully automated;
- the DAQI map is also fully automated and interpolates within each grid and site;
- the DAQI appears only on the local forecast page http://www.metoffice.gov.uk/public/weather/forecast/?tab=fiveDay
- the Met Office uses the unratified observations at the AURN background sites (which may themselves contain errors) for a rapid assessment the following day. Note that these data are not ‘ratified’ and are subject to alteration following examination by the data providers. The Met Office verifies on a rolling basis and does not have this information to hand for the unratified observations (although it can be regenerated). The Met Office recommends waiting until the data are ratified and then extracting them from the Defra site as the official portal for air quality observations;
- the air pollution model is not linked through to the Datapoint results of individual sites;
- the Met Office’s pollen forecast is not automated; and
- the DAQI index is only disseminated to the BBC (under a commercial contract).
The Met Office advises the use of ‘ensemble’ weather forecasts for forecasts beyond five days. Other warnings (e.g. floods) are given an impact, likelihood rating.
CAL understands the Met Office is considering developing higher resolution forecasts perhaps including urban air pollution e.g. roadside. This would address a current reporting issue that background sites are highly unlikely to breach an alert threshold for nitrogen dioxide which is correlated with road traffic and gas combustion. CAL would expect background or regional monitoring stations to record occasionally ‘Moderate’ or ‘High’ particle concentrations in the winter months and occasionally ‘Moderate’ or ‘High’ ozone concentrations in the summer months.
http://www.londonair.org.uk/london/asp/airpollutionindex.asp
http://www.londonair.org.uk/london/asp/airpollutionhealth.asp?HealthPage=HealthAdvice
The role of Public Weather Service Customer Group is important. ‘Outputs’ are laid before Parliament and the Annual Report 2011/12 was published in May.
The Department for Business, Innovation and Skills is responsible for the Met Office.
6. People exposed to background air pollution i.e. not including urban roadside air pollution
On 23 October 2012, the Government told the European Commission that 440,439 people in background locations in London in 2011 were exposed to concentrations of NO2 exceeding the annual mean legal limit. No attempt was made by the Government to assess population exposure at the roadside.
The Government frequently changes these estimates which are hidden anyway in complex computer spreadsheets. For more details see:
http://cdr.eionet.europa.eu/gb/eu/annualair/envugvtza
and
http://cdr.eionet.europa.eu/gb/eu/annualair/envtom4wa
and
http://rod.eionet.europa.eu/obligations/137/deliveries?id=137&tab=deliveries&d-4014547-p=9
CAL 217 Great Smog by GLA 2002
CAL 217 Government smog forecasts 061212 vs LAQN_Reduced file size
CAL 217 LAQN bulletin for 061212 ie actual
CAL 217 Pollution Check during Olympics_Draft 261012
http://en.wikipedia.org/wiki/Margaret_Thatcher
CAL 217 ONS weekly deaths_Week 8_220213
CAL 217 ONS weekly deaths_Week 11_150313
CAL 217 ONS weekly deaths_Week 17_260413

