‘Clean Air in London’ (CAL) estimates 5,061 deaths attributable to dangerous airborne particles (PM2.5) in London in 2020 and 5,159 in 2025. These compare with the Mayor’s estimate of 4,267 for PM2.5 in 2008. CAL estimates 2,684 deaths attributable to nitrogen dioxide (NO2) in London in 2020 and 1,893 in 2025 with up to one-third overlap with PM2.5 giving totals of 6,851 and 6,422 attributable deaths in 2020 and 2025 respectively. The new totals are significantly larger than previous estimates because they include the first estimates for NO2 and population increases which more than offset projected reductions in PM2.5
CAL speculates that total annual deaths attributable to NO2 and PM2.5 currently may be around 7,500 in London and around 55,000 in the UK compared to 29,000 for anthropogenic PM2.5 alone in 2010 (when NO2 mortality was not identified). Ozone may be responsible for a further 5,000 to 10,000 attributable deaths in the UK. We await official estimates from COMEAP and Public Health England (PHE) next year
CAL asks Parliament’s Environmental Audit Committee to recommend the prioritisation of COMEAP and PHE’s work calculating NO2 mortality estimates and their inclusion annually thereafter in the Public Health Indicators. Separately, CAL urges President Juncker to prioritise implementation of the Clean Air Policy Package in the European Commission’s 2015 Working Programme on 16 December not scrap it, as he has proposed, which would condemn hundreds of thousands of Europeans to an early death
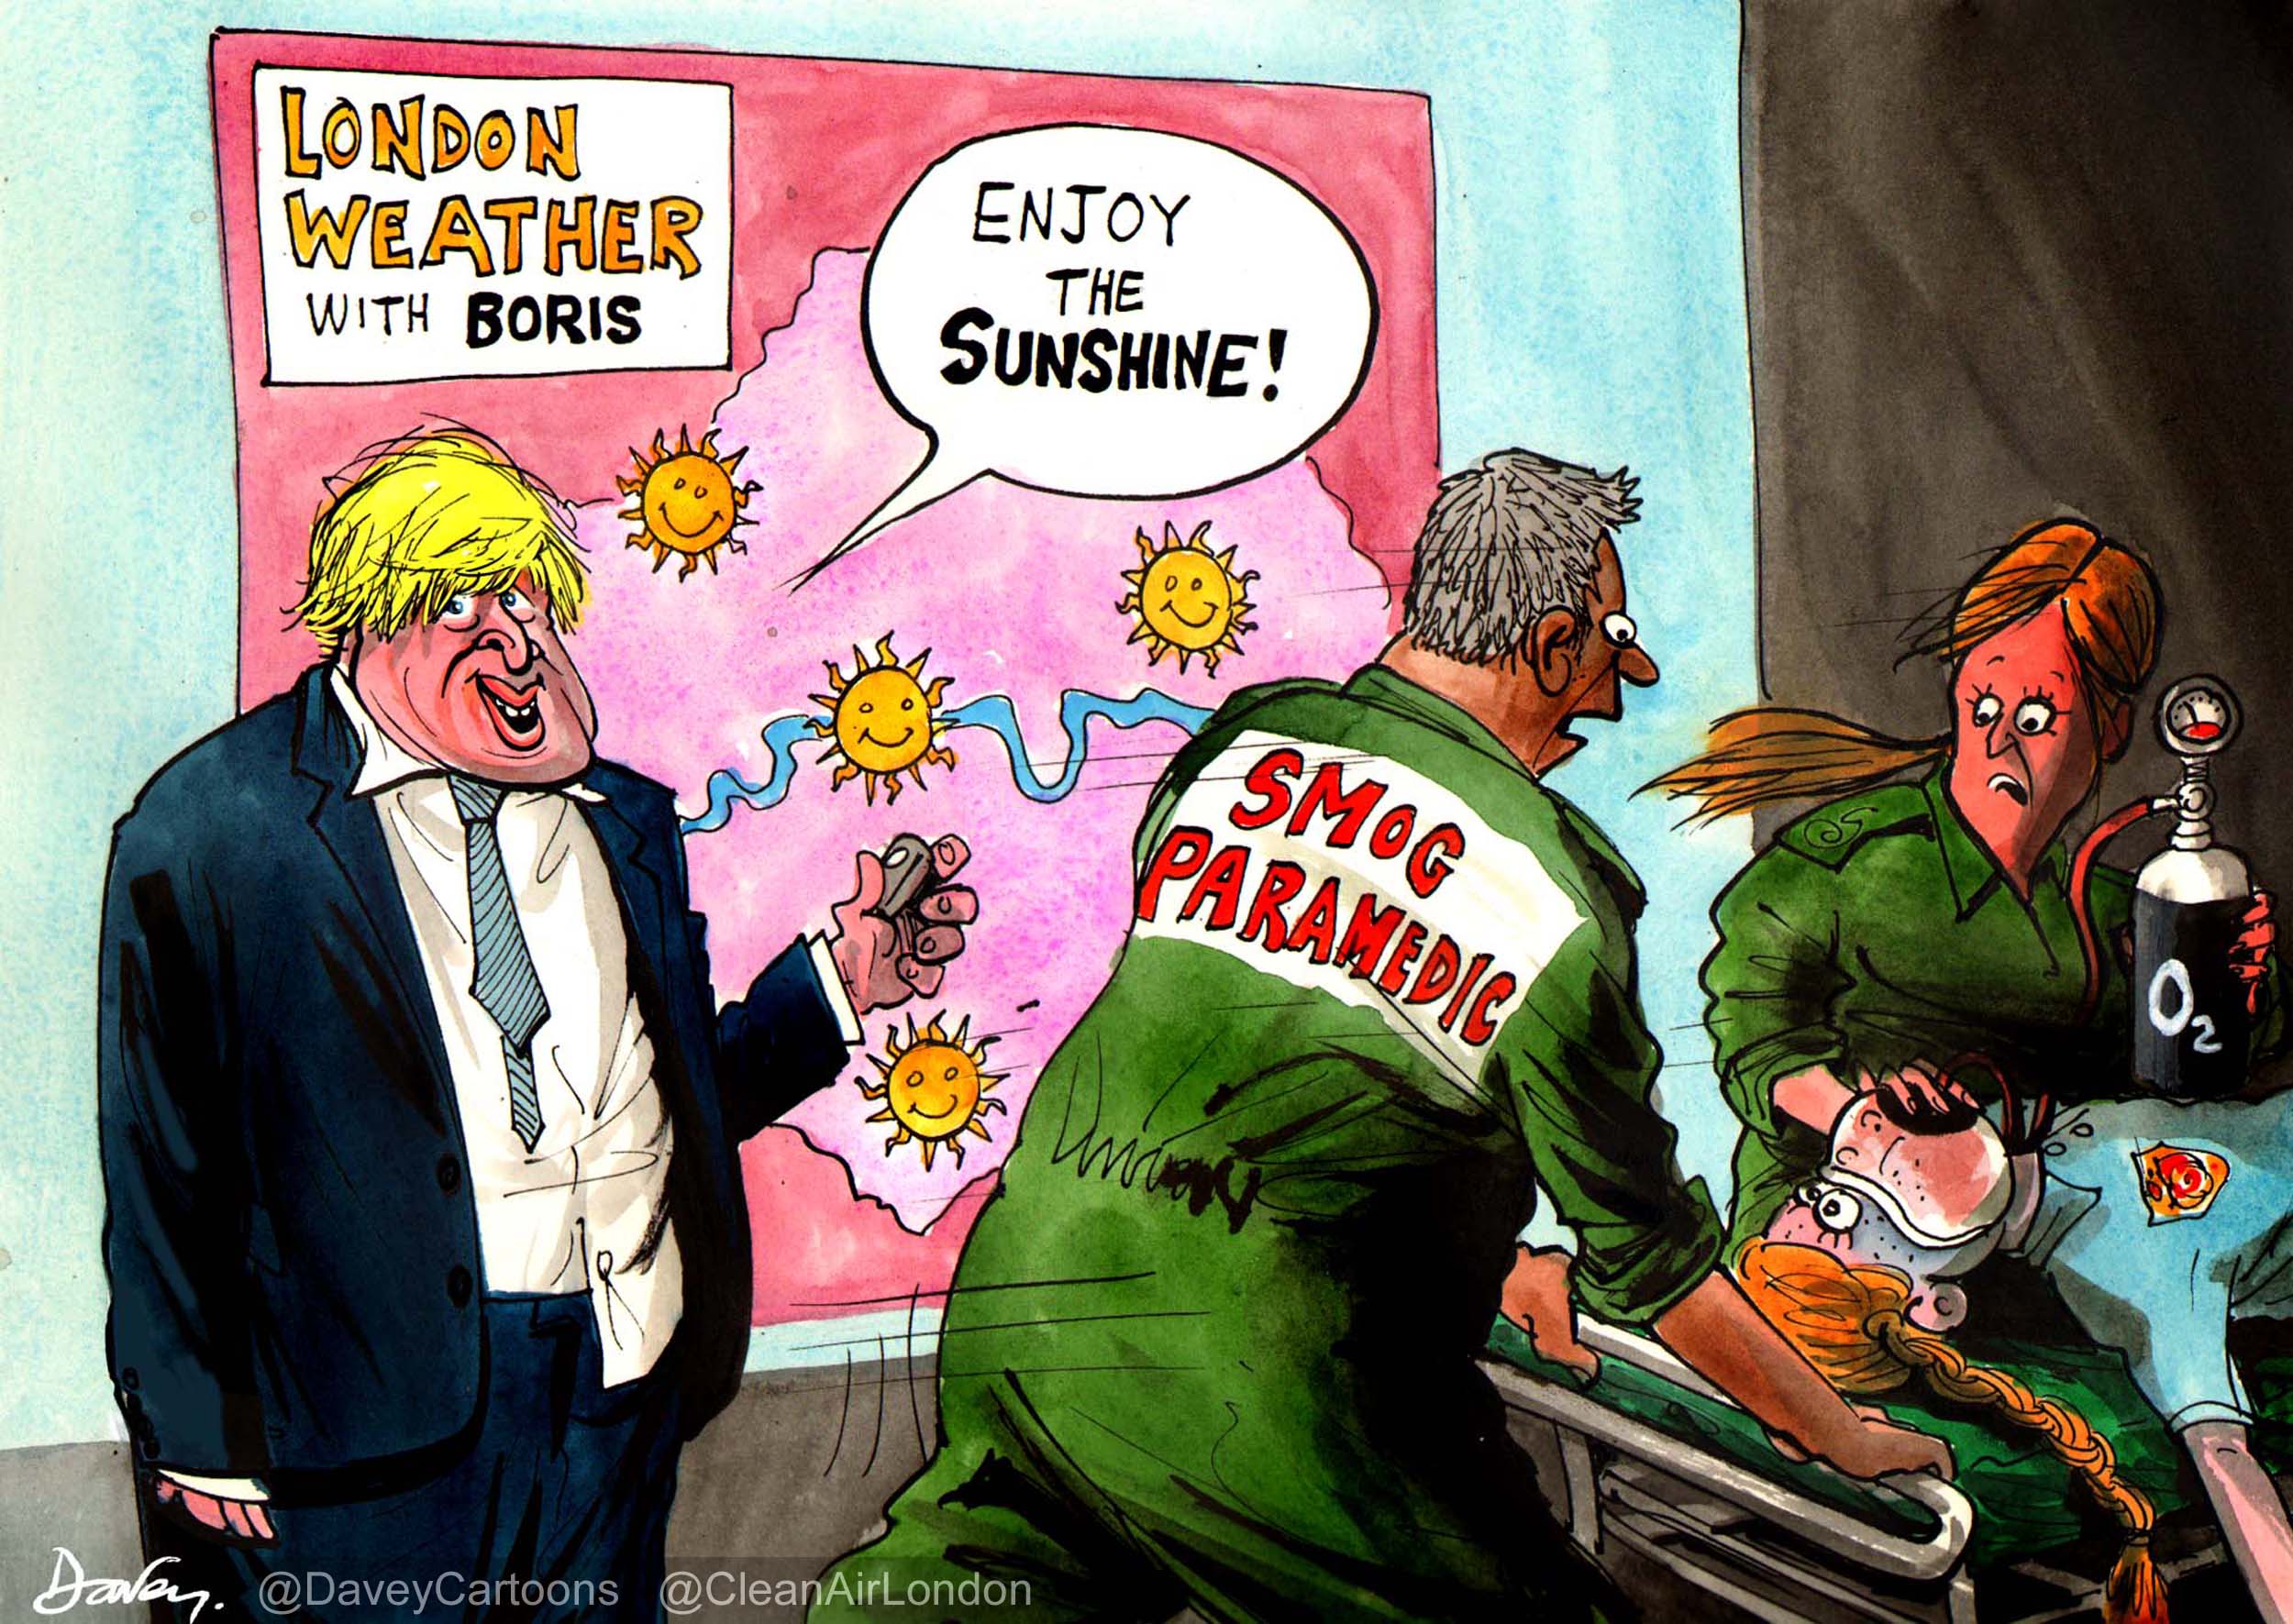
CAL congratulates Mayor Johnson for publishing these new estimates for ‘Years of life lost’ attributable to air pollution. However, the new estimates confirm again that the Mayor’s so-called ULEZ in 2020 is too small, too weak and too late
The Mayor has published documents supporting the consultation on his proposed Ultra Low Emission Zone (ULEZ) including a Health Impact Assessment (HIA). The consultation runs until 9 January 2015.
https://consultations.tfl.gov.uk/environment/ultra-low-emission-zone
https://cleanair.london/wp-content/uploads/CAL-294-ULEZ-HIA_Final_ULEZ-consultation_Reduced-size.pdf
The HIA estimates the health impact of dangerous airborne particles (PM2.5 and PM10) and nitrogen dioxide (NO2) on Londoners in 2020 and 2025. It then estimates the improvement expected from implementing the ULEZ. The Base Cases presented for 2020 and 2025 are the first updates produced by the Mayor since his ground breaking Health Study for 2008 was published on 29 June 2010.
https://cleanair.london/wp-content/uploads/CAL-098-Mayors-health-study-report-June-2010.pdf
As far as Clean Air in London (CAL) is aware, the HIA includes the world’s first published estimates of mortality attributable to NO2. The HIA also includes estimates for hospital admissions, costs and other valuable information.
Dangerous airborne particles
In June 2010, the Mayor estimated 4,267 deaths attributable to long-term exposure to PM2.5 in London in 2008. His estimate assumed: the population of Greater London was 7.67 million; and a population-weighted annual mean concentration of PM2.5 of 15.3 micrograms per cubic metre (mg/m3).
Since then the Committee on the Medical Effects of Air Pollutants (COMEAP) and Public Health England (PHE) have recommended using an average loss of life per attributable death of 12 years (Notes 4 and 5) for those dying aged 30 and older. The HIA estimates total years of life lost in 2020 and 2025. Therefore, using CAL’s understanding of COMEAP and PHE methodology, it has calculated the number of deaths attributable to PM2.5 for each of 2020 and 2025.
CAL estimates for PM2.5:
- 5,061 deaths attributable to long-term exposure to PM2.5 in London in 2020. This estimate assumes: the population of Greater London will be 9.13 million; and a population-weighted annual mean concentration of PM2.5 of 12.6 mg/m3.
- 5,159 deaths attributable to long-term exposure to PM2.5 in London in 2025. This estimate assumes: the population of Greater London will be 9.48 million; and a population-weighted annual mean concentration of PM2.5 of 12.2 mg/m3.
CAL assumes these are total concentrations of PM2.5 i.e. anthropogenic and non-anthropogenic PM2.5.
Defra estimated total PM2.5 in London in 2012 at 13.9 mg/m3. See the Clean Air in Cities app for details https://cleanair.london/apps/.
Nitrogen dioxide
In 2013, the World Health Organisation (WHO) published ‘state of the science’ reports on the health impacts of air pollution titled ‘Review of evidence on health aspects of air pollution’ (REVIHAAP) and ‘Health risks of air pollution in Europe’ (HRAPIE).
The HRAPIE report included the first guidance for estimating the mortality impact of NO2. The HIA says NO2 impacts should be reduced by (up to) 33% to account for possible overlap with effects from long-term PM2.5 exposure and uses the lag profile recommended by COMEAP.
The HIA estimates total years of life lost in 2020 and 2025 assuming a threshold for the mortality impacts of NO2 at an annual mean of 20 mg/m3. CAL has calculated estimates of total mortality assuming an average of 12 years of life lost per attributable death for NO2 (i.e. the same as PM2.5) as there is evidence of a long-term effect of NO2 on mortality as great as that of PM2.5. Fewer ‘average years of life lost’ would mean more attributable deaths not fewer. We await confirmation from COMEAP, PHE or the WHO that this approach is correct.
CAL estimates for NO2:
- 2,684 deaths attributable to long-term exposure to NO2 in London in 2020. This estimate assumes: the population of Greater London will be 9.13 million; and a population-weighted annual mean concentration of NO2 of 31.0 mg/m3 i.e. 11.0 mg/m3 above the threshold.
- 1,893 deaths attributable to long-term exposure to NO2 in London in 2025. This estimate assumes: the population of Greater London will be 9.48 million; and a population-weighted annual mean concentration of NO2 of 27.3 mg/m3 i.e. 7.3 mg/m3 above the threshold.
CAL has heard suggestions that there may be no threshold for the mortality impact of NO2 i.e. like PM2.5. If this were the case, the total mortality impact of NO2 would approximately treble for 2020 and 2025 with many more deaths attributable to NO2 than PM2.5. For the avoidance of doubt, CAL does not advocate such an approach as it would conflict with WHO advice in HRAPIE.
Total mortality
CAL has estimated total mortality attributable to PM2.5 and NO2 by deducting one-third from the smaller NO2 estimate as the HIA and HRAPIE recommend. On this basis, CAL estimates a Base Case of 6,851 deaths attributable to PM2.5 and NO2 in 2020; and 6,422 deaths attributable to PM2.5 and NO2 in 2025.
Nationally, if the attributable fraction for NO2 and total PM2.5 (plus ozone and short and long-term effects?) doubled from around 5 to 9% to around 10 to 18% this would be relevant for around 50,000 reported deaths in London and 550,000 reported deaths in the UK of people aged 30 and older. Air pollution levels in Greater London are about 50% higher than the UK average.
CAL speculates therefore that total deaths attributable to NO2 and PM2.5 currently may be around 7,500 in London and around 55,000 in the UK compared to 29,000 for anthropogenic PM2.5 alone in 2010 (when NO2 mortality was not identified). In CAL’s opinion, ozone may be responsible for a further 5,000 to 10,000 attributable deaths in the UK. We await official estimates from COMEAP and PHE next year.
Other information
The HIA report also:
i. estimates that 653,000 people will be exposed to NO2 above the annual mean limit value in 2020 falling to 123,000 in 2025. Of these 300,000 and 58,000 respectively are estimated to live within the area covered by the Central London ULEZ.
ii. shows the 20 boroughs with the highest number of people exposed to NO2 exceeding the annual mean limit value in 2020 in descending order are: Westminster; Camden; Southwark; Kensington and Chelsea; Tower Hamlets; Lambeth; Islington; Brent; Hammersmith and Fulham; Wandsworth; Hackney; Newham; Barnet; Haringey; Lewisham; Waltham Forest; Hounslow; Ealing; Greenwich; and Redbridge. The City of London has a small population but appears next.
iii. a Base Case of population-weighted annual mean concentrations of PM2.5 by area in 2020: Central London 14.4 mg/m3; Inner London 13.1 mg/m3; Outer London 12.3 mg/m3; and London-wide 12.6 mg/m3.
iv. a Base Case of population-weighted annual mean concentrations of NO2 by area in 2020: Central London 42.5 mg/m3; Inner London 34.7 mg/m3; Outer London 28.2 mg/m3; and London-wide 31.0 mg/m3.
v. total chronic mortality health values of £2,126 million for PM2.5 and £1,123 million for NO2 (2012 prices).
vi. the proportion of Care homes, Hospitals and Schools exceeding the NO2 annual mean limit value in Central London falling from 20.0%, 50.9% and 34.2% respectively to 0.0%, 17.5% and 5.1% respectively as a result of the Central London ULEZ.
CAL notes that Transport for London estimated in November 2006 that Phase 3 of the Low Emission Zone, if implemented in October 2010, would reduce the number of people exposed to NO2 exceeding the annual mean limit value in Greater London from 443,000 to 408,000 in 2015.
Questions
Questions that arise include:
i. How many deaths does the Mayor consider are currently attributable to NO2 and PM2.5 in London? What about O3 and SO2?
ii. Why did London report 47,580 deaths in London in 2013 compared to 458,110 in England outside London compared to populations of 8.42 million and 48.53 million respectively i.e. 0.56% compared to 0.94%? Oddly, there were 48,297 deaths in London in 2010 with a population of 7.82 million. It may be due in part to a ‘warm’ winter in 2013. The reported deaths number is used to estimate air pollution mortality.
iii. Why did the HIA not follow Defra appraisal guidance that recommends that the impacts of other pollutants (notably SO2 and O3) should be captured in an impact assessment? See page 13 in the ‘ULEZ Health Impact Assessment’. There may be some or complete overlap between PM2.5, NO2 andSO2 and O3 health impacts.
CAL considers the HIA statement on page 12 of the ULEZ Health Impact Assessment to be ‘out of date’:
“There is also increasing evidence that chronic exposure to NO2 may be important but the evidence for an association that is suitable for quantification of the impacts is less strong than for particles and not yet sufficiently convincing to be used widely.”
REVIHAAP states on page 73:
“Both short- and long-term studies have found these associations with adverse effects at concentrations that were at or below the current EU limit values, which for NO2 are equivalent to the values from the 2005 global update of the WHO air quality guidelines. Chamber and toxicological evidence provides some mechanistic support for a causal interpretation of the respiratory effects. Hence, the results of these new studies provide support for updating the 2005 global update of the WHO air quality guidelines (WHO Regional Office for Europe, 2006) for NO2, to give: (a) an epidemiologically based short-term guideline value; and (b) an annual average guideline value based on the newly accumulated evidence. In both instances, this could result in lower guideline values.”
Quotes
Simon Birkett, Founder and Director of Clean Air in London, said:
“Clean Air in London (CAL) congratulates Mayor Johnson for publishing these new estimates for the health impact of air pollution in London including the world’s first, as far as we know, published estimates of deaths attributable to nitrogen dioxide (NO2).
“These new estimates of NO2 mortality are particularly significant for Londoners as many roads in central London will tend to have the highest NO2 concentrations in the world. Earlier this year, Dr David Carslaw, a highly respected scientist, raised the possibility that measurements of NO2 concentrations recorded at the Oxford Street roadside air pollution monitoring site were, to his knowledge, the highest in the world. NO2 annual concentrations and hourly exceedances in Brixton Road may exceed those in Oxford Street in 2014.
“These new health estimates are shocking enough but they may still be underestimates. Factors which would increase them include: Euro 6 engine standards for diesel vehicles not delivering emission reduction as expected; more deaths being reported by the Office for National Statistics for Greater London; scientists determining there is no threshold for mortality impacts from NO2; more congestion as many hundreds of thousands of people visit and live and work in London and wish to drive cars; and climate change worsening London’s heat island effect.
“In 2009, CAL accused the previous Government of one of the biggest public health ‘cover-ups’ or failings in modern history for not publishing estimates of the number of people dying early from long-term exposure to PM2.5. Our claims were investigated by Parliament’s Environmental Audit Committee and subsequently confirmed with Public Health England now publishing estimates annually for every local authority in England. The current situation is very different. Similar estimates for NO2 are being calculated just months after scientists and World Health Organisation issued new advice.
“The first NO2 mortality estimates for London confirm the Mayor’s so-called Ultra Low Emission Zone (ULEZ) is too small, too weak and too late. The Mayor must ban all diesel exhaust (and biomass burning) from the most polluted places by 2020, with an intermediate step by 2018, as coal was banned so successfully 60 years ago. At least 10 boroughs should be included.
“At a European level, President Juncker must prioritise implementation of the Clean Air Policy Package (CAPP) in the European Commission’s 2015 Working Programme on 16 December not scrap it, as he has proposed, which would condemn hundreds of thousands of Europeans to an early death. The CAPP made financial sense even though NO2 mortality costs were not incorporated in it.
“We must create a better city and Europe. London should be leading the world in fighting air pollution as we did 60 years ago.
ENDS
Notes
1. Mayor’s Ultra Low Emission Zone consultation – closes 9 January 2014
https://consultations.tfl.gov.uk/environment/ultra-low-emission-zone
2. ULEZ Health Impact Assessment – October 2014
https://cleanair.london/wp-content/uploads/CAL-294-ULEZ-HIA_Final_ULEZ-consultation_Reduced-size.pdf
3. Mayor’s Health Impact Assessment 2008
https://cleanair.london/wp-content/uploads/CAL-098-Mayors-health-study-report-June-2010.pdf
4. COMEAP
19 June 2009
21 December 2010
August 2012
5. Public Health England
Public Health Indicators 2012
http://www.phoutcomes.info/public-health-outcomes-framework#gid/1000043/par/E12000004/ati/102/page/3
6. World Health Organisation reports
REVIHAAP
HRAPIE
7. NO2 meta analysis
http://erj.ersjournals.com/content/early/2014/02/20/09031936.00114713.abstract
8. Defra data
PM2.5
http://uk-air.defra.gov.uk/data/pcm-data
NO2
http://uk-air.defra.gov.uk/data/gis-mapping
9. NO2 levels in London
Brixton Road 2014
Oxford Street 2014
Comment by King’s College London on NO2 levels in London
http://www.londonair.org.uk/london/asp/news.asp?NewsId=OxfordStHighNO2&StartIndex=21
10. Office for National Statistics data
http://www.ons.gov.uk/ons/rel/vsob1/deaths-registered-area-usual-residence/2012/index.html
11. Clean Air Policy Package
http://ec.europa.eu/environment/air/clean_air_policy.htm
See the ‘Impact assessment’ pages 111 and 185
http://ec.europa.eu/environment/archives/air/pdf/Impact_assessment_en.pdf
CAL 294 ULEZ HIA_Final_ULEZ consultation_Reduced size
CAL 294 ULEZ Supplementary information_Final 291014
CAL 295 WHO REVIHAAP Final technical report
CAL 295 TfL LEZ Supplementary information_November 2006_3 pages_Reduced file size
CAL 295 PHE estimates of PM2.5 local mortality 2010
CAL 295 COMEAP FINAL_Local_mortality_burden_statement_August_2012