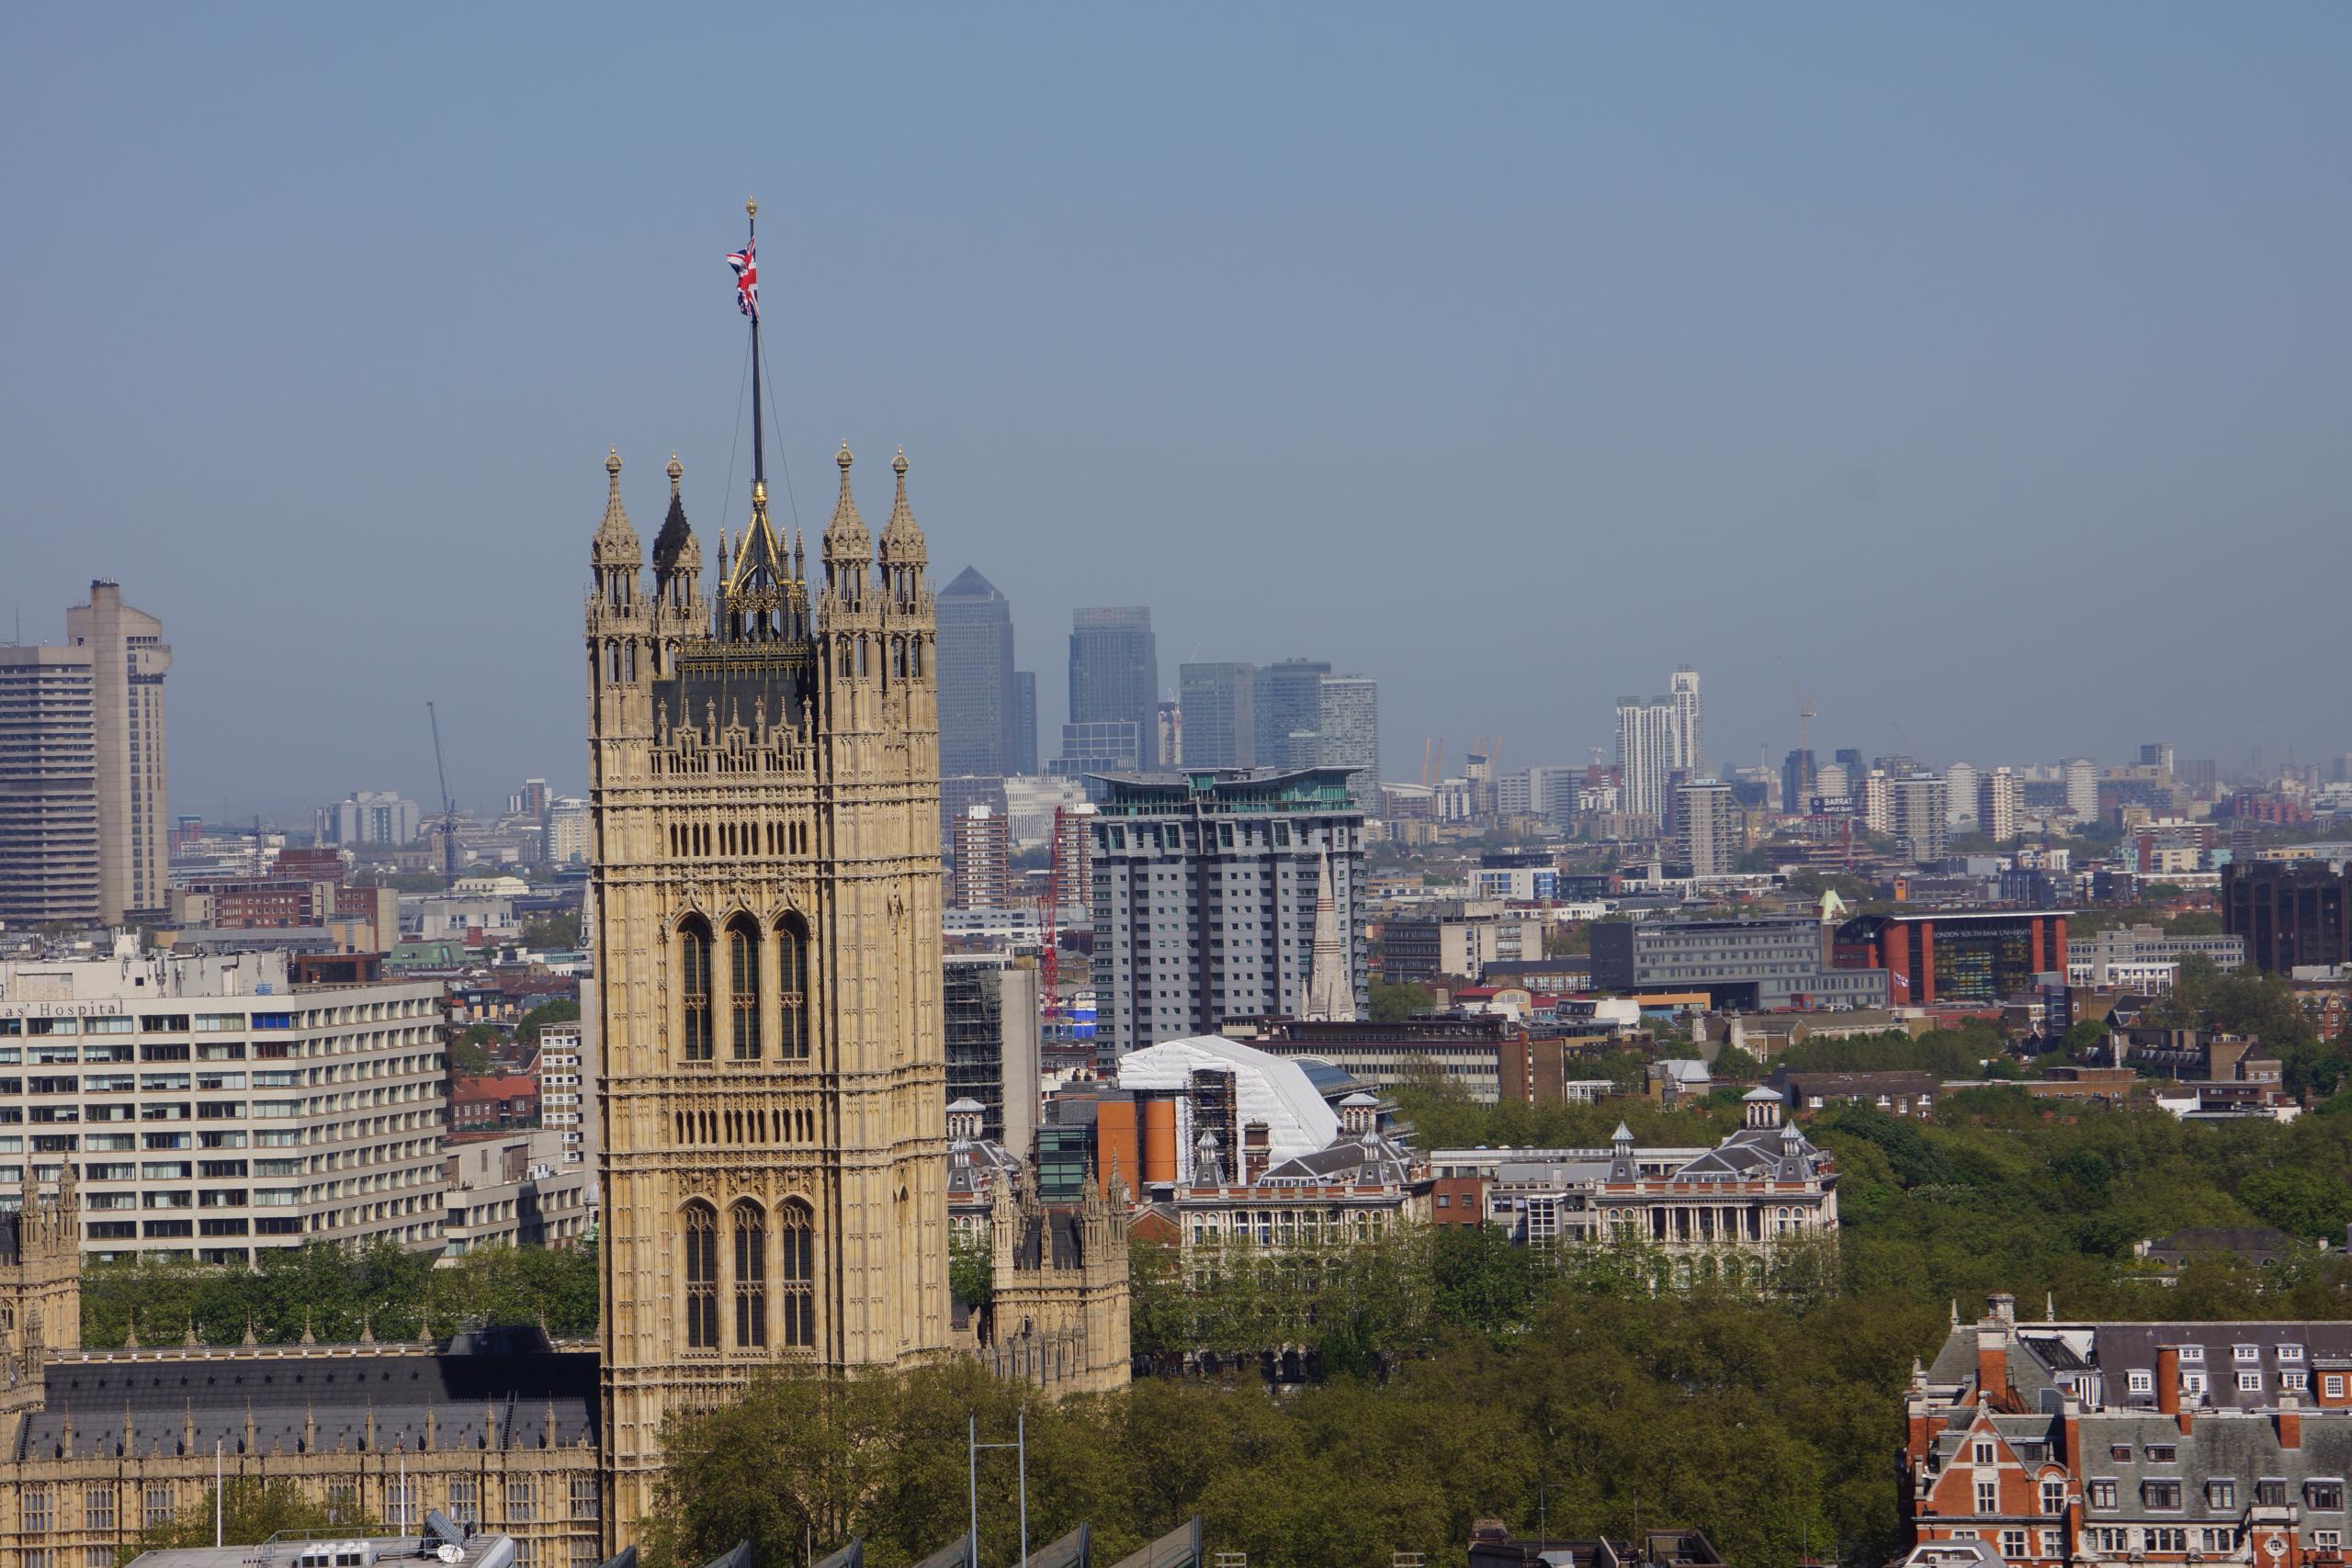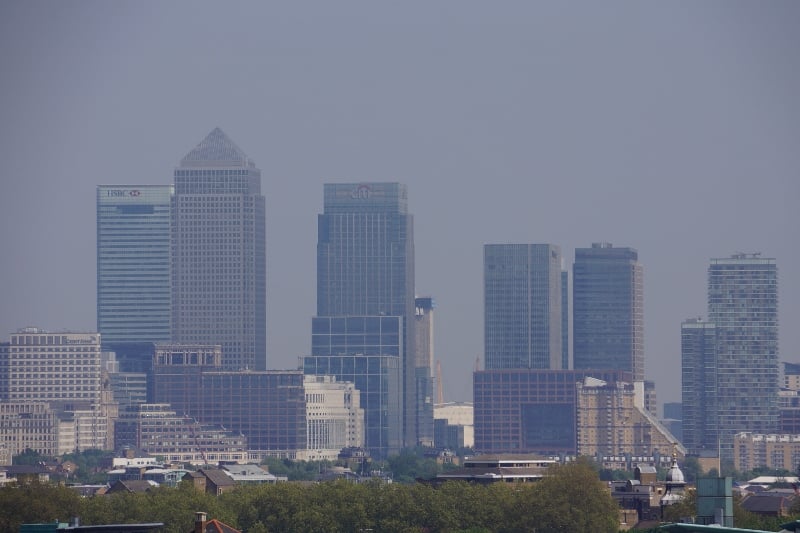
Clean Air in London’s (CAL’s) analysis of the latest data confirms that London had the highest levels of nitrogen dioxide (NO2), a toxic gas, of any capital city in Europe in 2010. Concentrations of dangerous airborne particles (PM10) are much higher in Beijing than London but levels of NO2 are comparable in the two cities.
Earlier articles for Politics Home by CAL have described the main air pollutants, their impact on health and the legal situation. CAL has also listed the 45 measures it recommends to protect health and comply fully with air quality laws. This article focuses on the level of air pollution in London and its sources and trends. In particular, it distinguishes between concentrations (which we breathe) and emissions (which come from sources like exhaust pipes). Other possible metrics for measuring air pollution include particle numbers and surface area. Results from monitoring stations need to be considered carefully because they may be sited in different types of locations e.g. Kerbside, Roadside, Background or Rural. A report in April 2011 highlighted glaring gaps in the London monitoring network and the Association of London Environmental Health Officers has asked Boris Johnson to address urgently the sustainable funding of the network.
The excellent London Air Quality Network (LAQN) shows that concentrations of NO2 in Marylebone Road in 2011 were an annual mean of 97 micrograms per cubic metre (ug/m3) and 229 hours over 200 mg/m3 i.e. Bad Air Hours. For PM10 the annual mean was 38 ug/m3 and there were 58 days over 50 ug/m3 i.e. Bad Air Days. The corresponding legal limits are 40 ug/m3, 18 Bad Air Hours, 40 ug/m3 and35 Bad Air Days. Legal limits for NO2 are aligned with World Health Organisation (WHO) guidelines but are around twice (i.e. very weak) those for PM10. There were more exceedances of the PM10 daily limit value in Marylebone Road in 2011 than in any year since the summer smog of 2003.
The excellent European Environment Agency (EEA) analyses data once it is formally reported by Member States which is nine months after the end of the previous calendar year. CAL has analysed the latest EEA data (i.e. 2010) which includes 2,798 monitoring stations for NO2 and 2,651 for PM10. Marylebone Road in London reported the fourth highest annual mean concentrations of NO2 at 98 ug/m3 behind individual sites in Florence (Italy), Stuttgart (Germany) and Munich (Germany). Only London (Marylebone Road and Camden), Florence, Paris, Rome and Stuttgart had two monitoring sites in the top 20 worst sites in 2010. Marylebone Road ranked 687th worst for annual mean PM10 in 2010. The LAQN shows monitoring stations exceeding the levels reported for Marylebone Road e.g. Euston Road in Camden for NO2 and Neasden Lane in Brent for PM10 but the Government chooses not to report that data as those sites are not part of its official network.
While only London within the UK has exceeded the PM10 legal limits in recent years, some 40 of 43 UK zones exceeded NO2 legal limits in 2010. A higher percentage of zones in the UK exceed the limit value plus margin of tolerance allowed for Member States in certain circumstances than any other Member State indicating that the UK has a major problem with NO2. The Government’s report to the European Commission in September 2011 estimated that 698,543 people in London in 2010 were exposed to concentrations of NO2 above the WHO guideline and legal limit.
The Mayor’s Air Quality Strategy in 2010 estimated modelled emissions for sources of key air pollutants (i.e. not concentrations). Road transport is the dominant source of PM10 emissions within central London contributing around 79% in 2008, 80% in 2011 and 75% in 2015. The most significant contributions from different vehicle types in 2008 were: cars 23%; taxis 25%; and light goods vehicles 10 to 20%. Around 35% of PM10 emissions from road transport in central London comes from tyre and brake wear. Other sources of PM10 emissions include boilers and gas combustion. Boris Johnson estimates road transport is the main source of PM2.5 emissions in London, contributing around 80% in 2008.
The Government’s favouring of diesel over petrol is a serious problem in cities as is Boris Johnson’s 100% discount on the congestion charge for the Euro 5 version of such vehicles. A written Parliamentary answer dated 3 October 2010 confirmed that diesel passenger cars produce over 21 times the PM10 emissions of the petrol equivalent in grams per mile and over twice the emissions of oxides of nitrogen (NOx) (i.e. NO2 plus nitrogen monoxide). In the past decade, the market share of diesel passenger cars has increased from around 10% to 50% making it more difficult to control the most harmful emissions in cities. The International Agency for Research on Cancer, part of the WHO, classifies diesel engine exhaust as “carcinogenic to humans”.
For emissions of NOx, Boris Johnson estimates road transport and domestic gas (e.g. from cooking and heating) contributed 46% and 22% respectively in 2008. NOx emissions from commercial gas, industry, airports and rail are all estimated to contribute around 7 to 8% of emissions in 2008. Across Greater London, cars contribute the highest proportion of road transport emissions 35% whilst heavy goods vehicles are significant 30% and buses 21% (and just under 30% in 2015). Within central London buses become the most significant source of NOx emissions at around 40% in 2008 growing to just below 50% in 2015. Cars contribute around 20% as do HGVs and taxis and LGVs each contribute about 10% of emissions of NOx. Gas use from workplaces is more significant in central London, contributing around 30% in 2008.
Pollution levels can be influenced or distorted by other factors. Examples include: the weather (e.g. low wind speeds and sunshine for several days can create summer or winter smogs); and the use of pollution suppressants in front of official air quality monitors in London. London has already experienced six smog episodes in 2012. Since November 2011, Boris Johnson has been using converted gritter lorries to reduce levels of PM10 by around 10% in front of the monitoring stations most likely to report legal breaches of the Bad Air Day limit. CAL estimates, for example, that the use of pollution suppressants in Marylebone Road and Upper Thames Street, along the planned Olympic Route Network, may already have avoided one or both breaching the PM10 daily limit value; and reduced the number of HIGH smog alerts at those sites by between five and eight days (i.e. 71% and 89%). CAL has obtained video footage of the Pollution Suppressor operating at night in front of the Marylebone Road monitoring station on 26 March 2012.
Boris Johnson and the Government are determined to keep air pollution out of the public eye while they work hard behind the scenes to weaken air pollution laws. This is totally unacceptable. Instead, we need transparency and honesty about the levels of air pollution throughout our cities and its impact on health. A robust and complete monitoring network, banning the use of the Pollution Suppressor by official air quality monitors and smog alerts are an essential first step.
This is the fourth in a series of six articles being written for Politics Home by Simon Birkett, Founder and Director of Clean Air in London, about air quality in the lead up to the London 2012 Olympics. The six articles will address health impacts, legal issues, sources, solutions and opportunities; indoor air quality; and the Olympics.
CAL 178_1_Sources article 260412
CAL 178_2_AQ in London Paris Stockholm and Zurich 260412
CAL 178_3_Report on trends in AQ in London and EU Comparison 240412
CAL 178_4_Nitrogen dioxide_Beijing London Olympics
CAL 178_5_Road PM Monitoring Data 2001 to 2011_050112
CAL 178_6_Top 20 Cities (EEA data) in 2010 and the others
CAL 178_9_Trends Jan 2012 Extract

Other data from the European Environment Agency (EEA)
Further information gathered by the EEA about NO2 concentrations in cities can be seen at:
- In the Airbase database, the EEA stores the air quality data officially delivered annually under 97/101/EC Council Decision by national authorities and you can find raw data and some statistics at station level: http://www.eea.europa.eu/data-and-maps/data/airbase-the-european-air-quality-database-6
- For the Urban Audit project (http://www.urbanaudit.org/) a set of 6 indicators (2 of them related to NO2) are prepared every year. See:
- CAL 178_11_Eurostat_AQ_URAU_final_2011
- The core set indicator 4 (Exceedance of air quality limit values in urban areas), http://www.eea.europa.eu/data-and-maps/indicators/exceedance-of-air-quality-limit-1/exceedance-of-air-quality-limit-3 shows the percentage of population living in urban areas with exceedances of the regulated objectives for, among other pollutants, NO2. You can download the data used for its calculation.
CAL 186 Air quality trends and issues in London by Dr Gary Fuller KCL 200712