After seven years, Mayor is lucky to get a ‘C minus’ in new ranking of air quality in 23 European cities
Top five cities of Zurich, Copenhagen, Vienna, Stockholm and Berlin have either met, or are due to meet, the EU limit values within the next two years. In stark contrast, London has no plans to comply with nitrogen dioxide (NO2) legal limits until after 2030, if ever
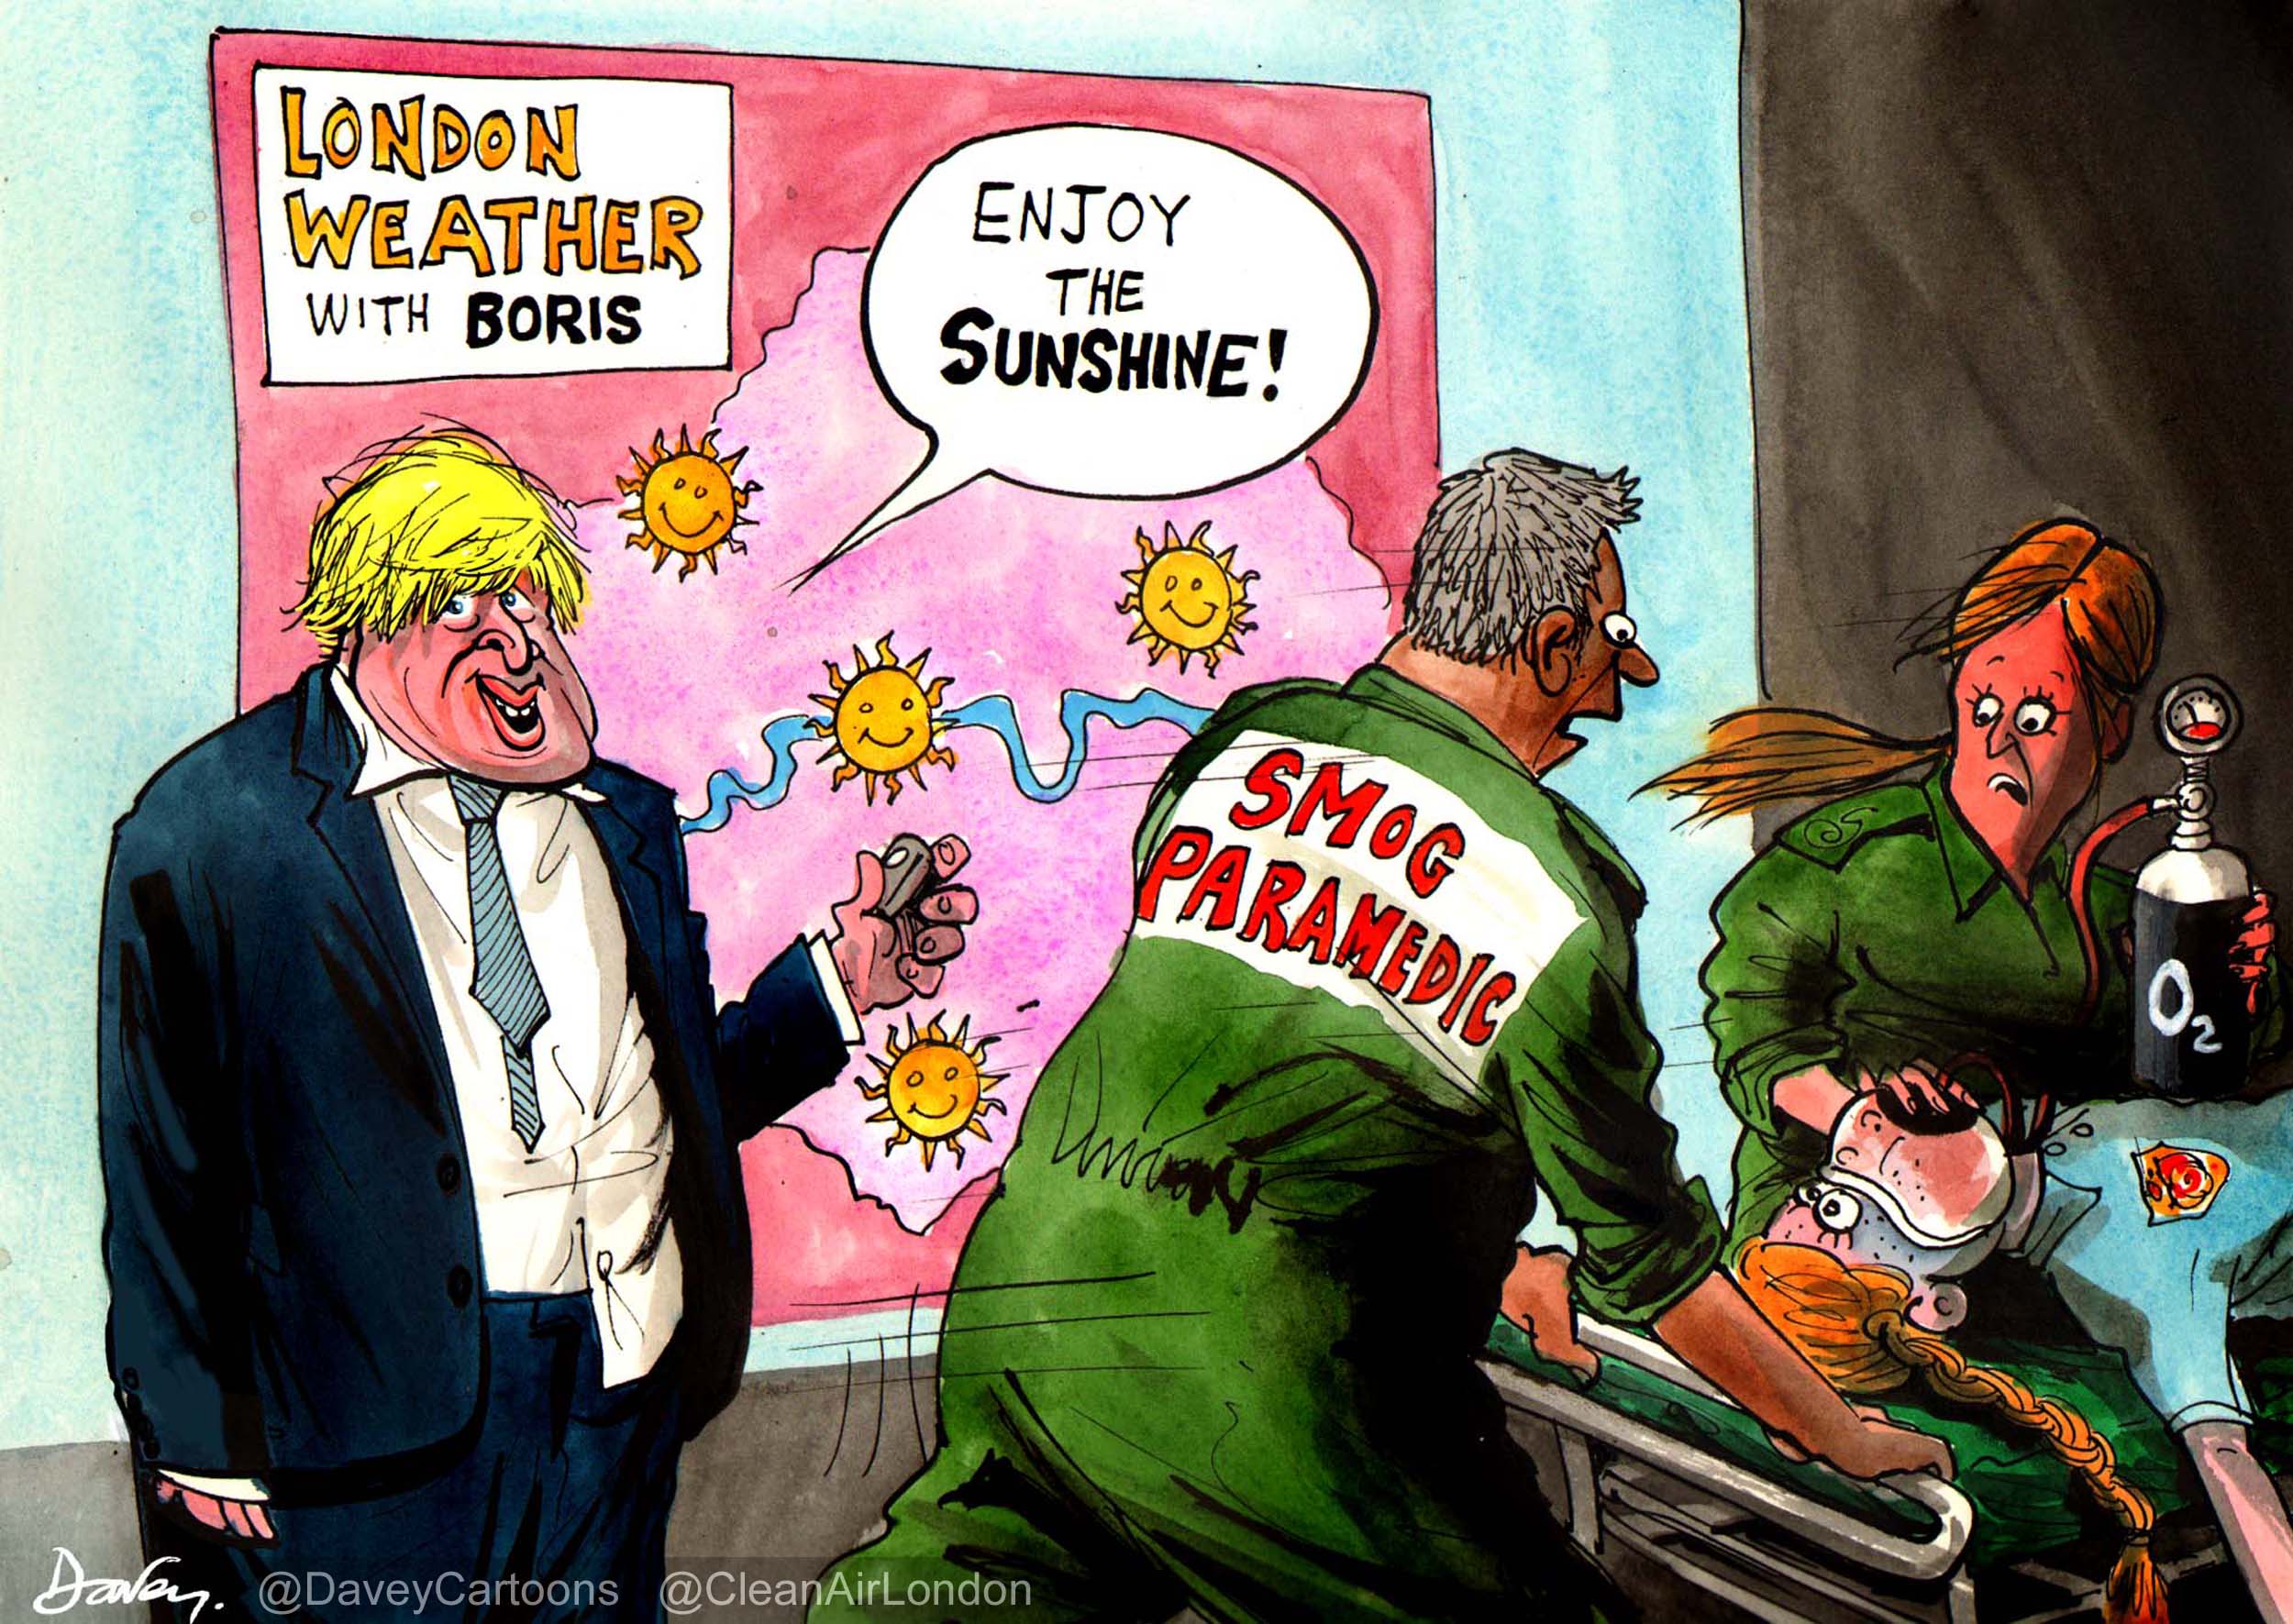
Many roads in central London will tend to have the highest concentrations of NO2 in the world. The Mayor admitted in a 49 page response to the evaluation that 82% of emissions of NO2 in London are generated within London compared to 24% of PM2.5. Mayor reduced average roadside concentrations of NO2, which are still about 400% of the EU legal limit and World Health Organisation guideline in Oxford Street, by just 12% between 2008 and 2013
People may have been misled by the Mayor’s claims that Zurich and Stockholm have worse air quality than London
Friends of the Earth in Germany (BUND), supported by members of the European Environmental Bureau (EEB), has published its new ranking of air quality in 23 European cities. The ranking assessed policies and air pollution levels with a focus on the period between 2010 and 2020. The ranking can be found here http://sootfreecities.eu/.
The top five cities in descending order are Zurich, Copenhagen, Vienna, Stockholm and Berlin. Of these, Copenhagen, Stockholm, Vienna or Berlin have either met, or are due to meet, the EU limit values within the next two years. Zurich has already progressed well beyond the EU’s norms.
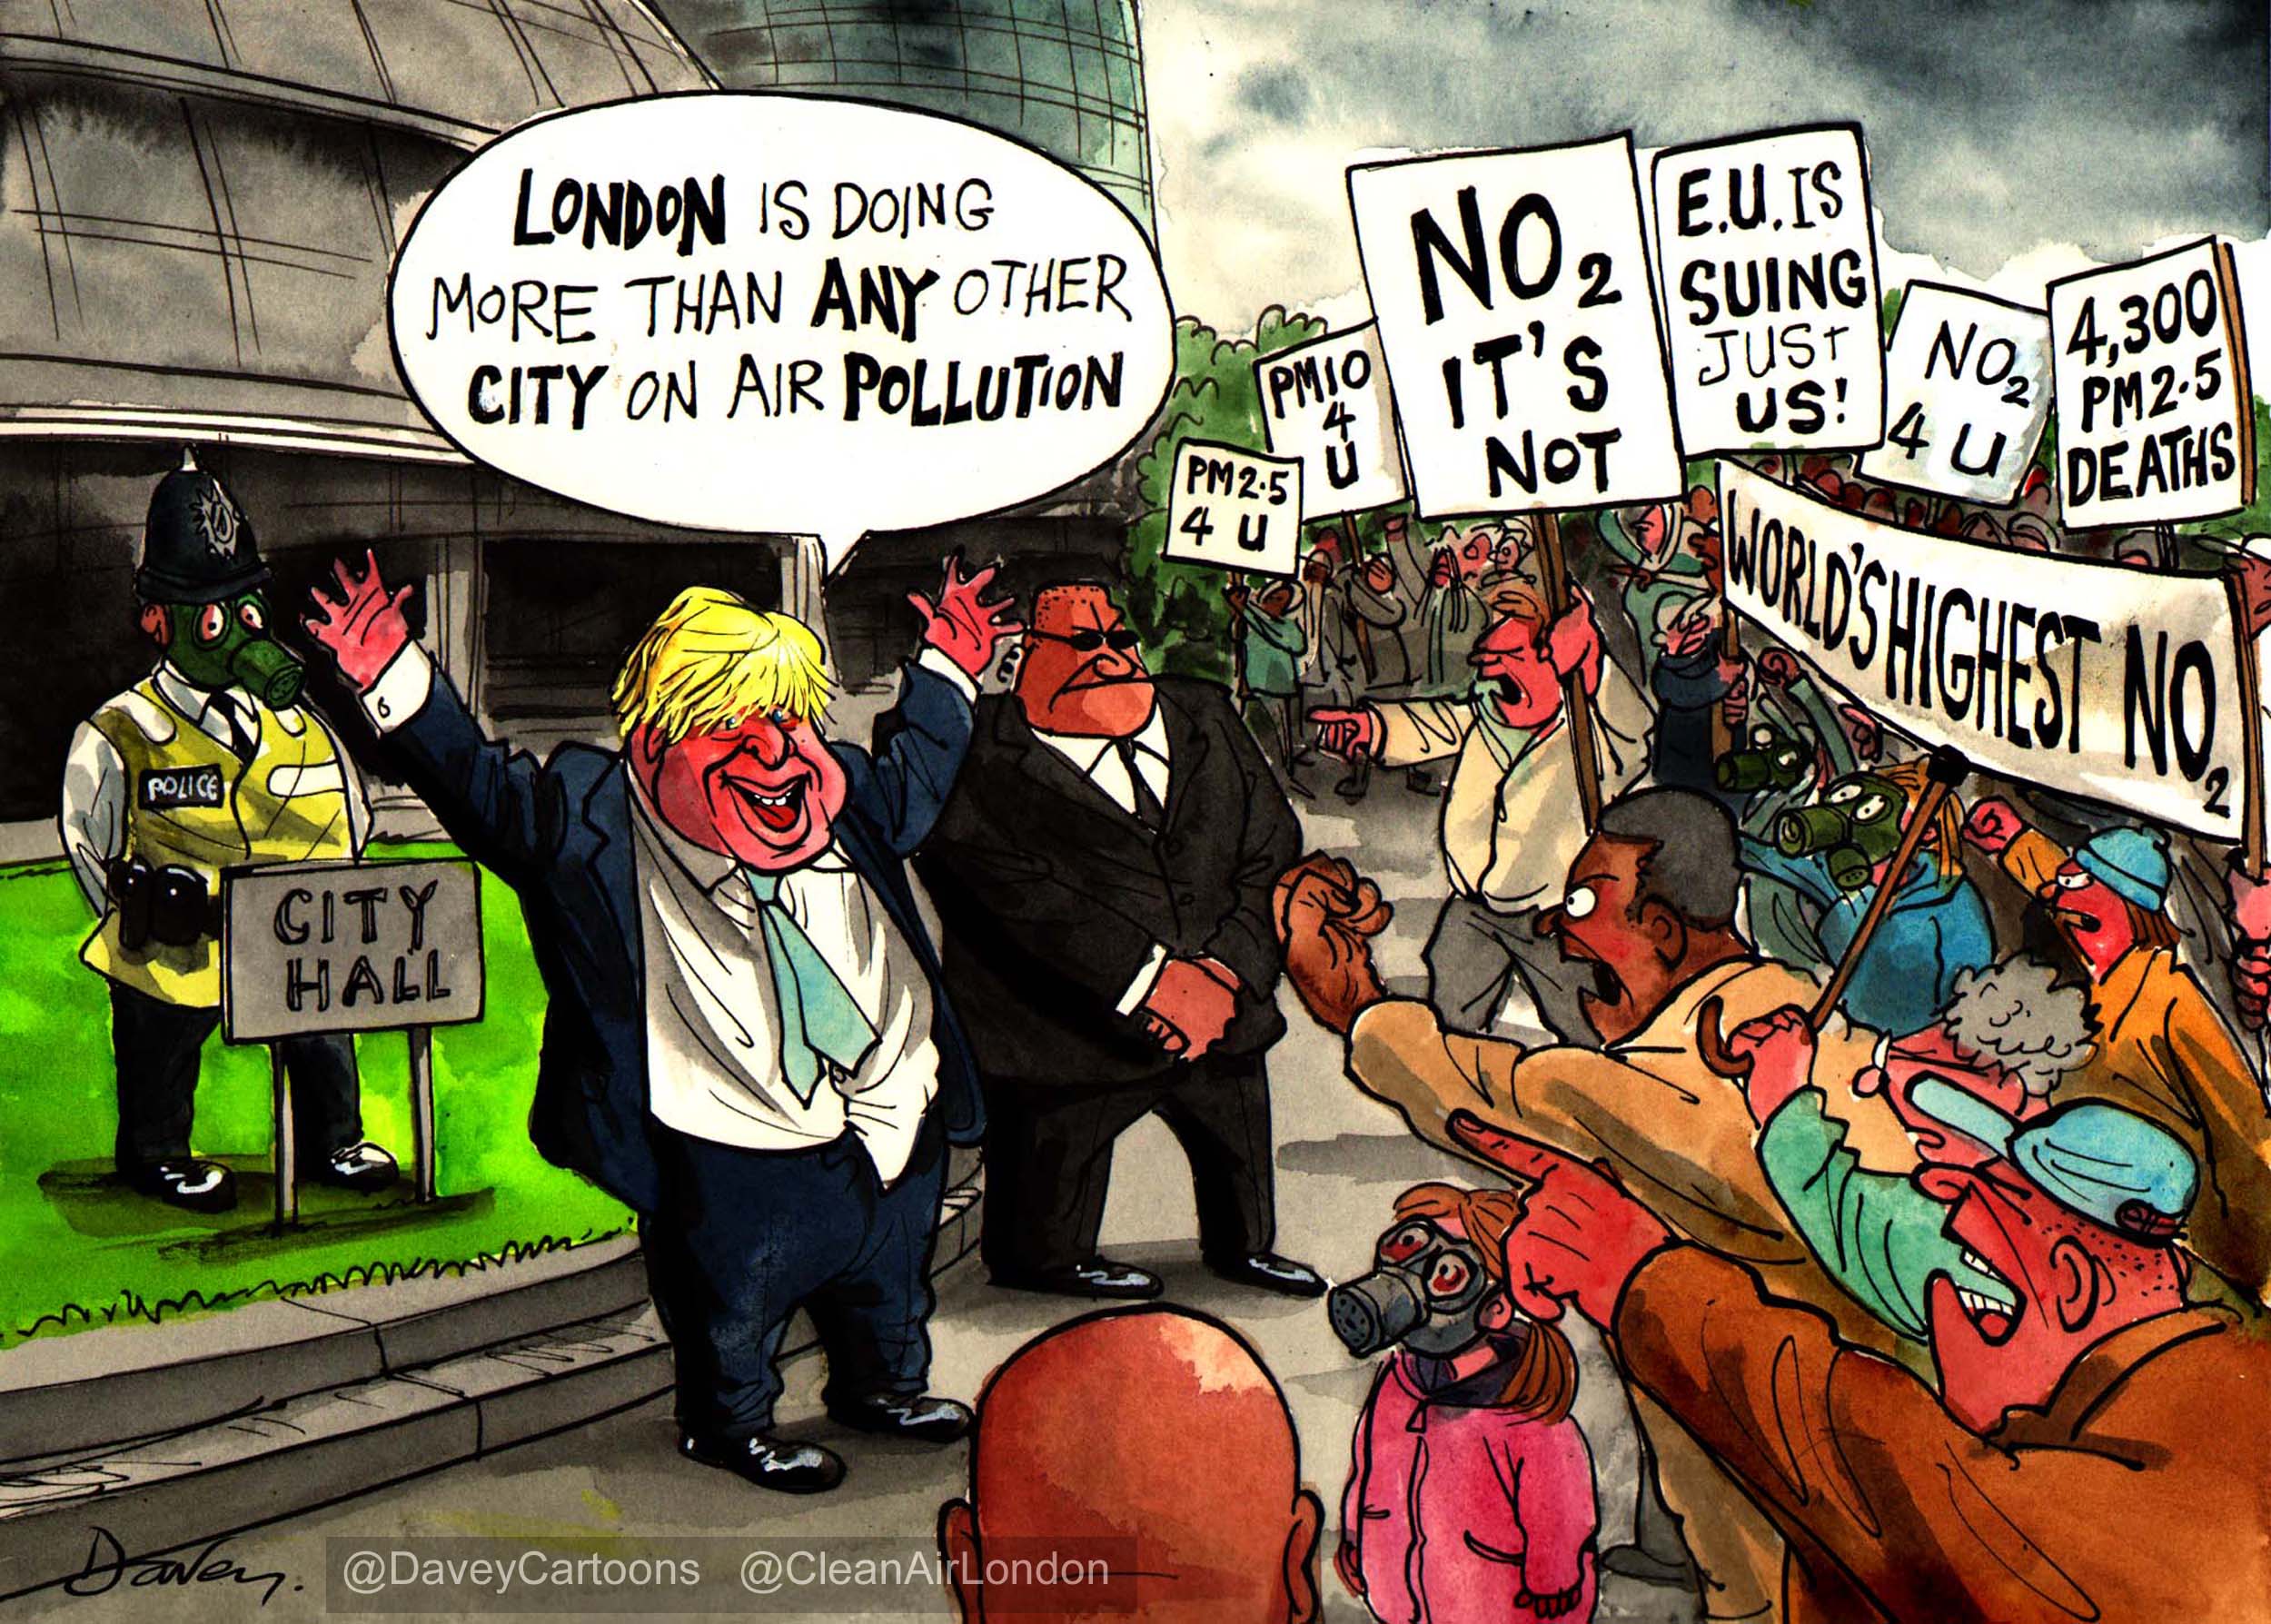
In contrast, London, Helsinki, Paris and Stuttgart are lucky to get a ‘C-minus’ in the survey. Many roads in central London will tend to have the highest concentrations of NO2 in the world and London does not expect to comply with EU limit values for NO2 until after 2030, if ever. London may have dropped three places (and one from the last ranking in 2011) to ninth if Helsinki, Paris and Stuttgart had bothered to complete the survey and many more places if it had not been for Crossrail.
The Mayor admitted in a 49 page response to the evaluation that 82% of emissions of NO2 in London are generated within London compared to 24% of PM2.5. This means that NO2 concentrations are a better indicator than PM2.5 of a city’s progress. The Mayor reduced NO2 concentrations, which are still about 400% of the EU legal limit and World Health Organisation guideline in Oxford Street, by just 12% between 2008 and 2013. We need action at a national, European and global level to achieve reductions in PM2.5.
Successful policies in Zurich and other top cities
The city of Zurich has emerged as the winner of the ‘Sootfree Cities’ ranking which graded the efforts of 23 major European cities to improve air quality. The Swiss city finished first thanks to a policy mix which includes a strong commitment to reduce pollution from vehicles, the promotion of cleaner forms of transport and low levels of air pollution.
Both in Zurich and in the runner-up city, Copenhagen, the number of cars has been substantially reduced and there are restrictions on highly-polluting vehicles such as diesel cars, trucks and construction machines. At the same time, cleaner forms of transport, such as public transport, cycling and walking have been greatly expanded. Vienna and Stockholm finish in third and fourth place, while the winner of the previous edition of the ranking, Berlin, comes in at number five. At the other end of the ranking, Lisbon and Luxembourg finished last for tackling air pollution in only a half-hearted manner.
Cities in Europe today are nevertheless hampered by inadequate action at an EU level to fight air pollution. Europe needs: to introduce effective rules that reflect the emissions of road vehicles under real driving conditions; strict norms that limit emissions from construction machinery; action to reduce methane emissions from agriculture; and a real tightening of Europe’s overall air pollution limits in 2020, 2025 and 2030. The latter would cut the amount of pollution each member state is allowed to emit and reduce long-distance pollution which cities are helpless to deal with.
Methodology
The ‘Sootfree Cities’ ranking evaluated 23 of Europe’s cities in nine transport-related categories including the promotion of sustainable transport, traffic management, public procurement and economic incentives, such as congestion charges and parking. The ranking also took into account how successful each city had been at reducing the pollution at its urban traffic stations. The ranking concentrated on measures put in place in cities over the past five years and looked at air quality plans for the next five years to take into account changes that were already in the pipeline.
Quotes
Simon Birkett, Founder and Director of Clean Air in London, said:
“Frankly, the Mayor is lucky to get away with a ‘C minus’ on air quality after seven years in office.
“The gap between London and the top five cities, which expect to comply with EU legal limits within two years, is staggering. The Mayor has no plan to comply with air pollution laws – which are breached by a massive margin along many central London roads – until after 2030, if ever.
“The best indicator of the Mayor’s progress is the evidence he submitted to Parliament’s Environmental Audit Committee on 24 October 2014 that initial analysis undertaken by King’s College London suggests that total average reductions in NO2 concentrations across London at roadside sites were in the order of 12% from 2008 to 2013. This is pitifully slow.
“People may have been misled by the Mayor’s claims that Stockholm and Zurich have worse air quality than London.”
http://www.mayorwatch.co.uk/what-does-your-vote-mean-for-londons-air-quality/
Arne Fellermann, Transport Policy Officer at BUND/Friends of the Earth Germany, commented:
“Our ranking shows that cities across Europe have been actively fighting air pollution because of the EU’s air quality standards. Although 90% of Europeans living in cities today are still breathing unhealthy air, Copenhagen, Stockholm, Vienna or Berlin have either met, or are due to meet, the EU limit values within the next two years. Zurich has already progressed well beyond the EU’s norms.”
Louise Duprez, Senior Policy Officer for Air Pollution at the European Environmental Bureau (EEB), said:
“The recent smog episodes in cities like London or Paris are a reminder that cities can do a lot to improve air quality, but they are left exposed to pollution they can’t control. This includes pollution from sources which are regulated at national or EU level and the pollution that has originated outside the city’s limits, like emissions from agriculture. The EU must act if it wants to prevent repeats of this month’s deadly smog.”
ENDS
Notes
1. NO2 concentrations in London
Many roads in central London will tend to have the highest NO2 concentrations in the world.
http://www.londonair.org.uk/london/asp/news.asp?NewsId=OxfordStHighNO2&StartIndex=31
In contrast, Zurich is well below the EU’s air quality limits although it currently fails to meet the far stricter Swiss standards.
2. European Commission’s ‘Clean Air Policy Package’
European cities need help in bringing down the level of background concentrations of particulate matter (PM2.5 and PM10), which are very harmful particles, and more effective tools to cut emissions of oxides of nitrogen (NOx) at the source. A proposal for an EU directive on Non-Road Mobile Machinery (NRMM) is currently being discussed at EU level. Limits to the air pollution emitted by each EU country for 2020, 2025 and 2030, also known as the National Emissions Ceilings (NEC) Directive, are also currently being discussed at EU level.
http://ec.europa.eu/environment/air/clean_air_policy.htm
3. Methodology
The full list of categories used are: pollution reductions; how comprehensive low emission zones and bans for heavy polluters are; how clean public procurement for transport is; how comprehensive the strategy for non-road mobile machinery is; what type of economic incentives are used; how successful the city is at managing road traffic and other transport modes; how comprehensive the city has been at promoting public transport; how successful the city is at promoting walking and cycling; and whether it provides attractive and comprehensive information to citizens about air quality.
CAL 302 City Ranking 2015_Final
CAL 302 City Ranking 2015_Methodology
CAL 302 City Ranking 2015_Background
CAL 302 Mayor’s response to City Ranking Questionnaire_2013_Redacted
CAL 302 Update on European City Ranking 310315 CAL 302 Mayor’s comparison of Air Quality in World Cities_Slide deck_Sept 2014
CAL 302 Mayor’s comparison of Air Quality in World Cities_Study_Sept 2014
CAL 303 NO2 NOx percentages 2008 to 31 March 2015_050415
CAL 304_150529-nabu-cleanair_shipping_manual_2015