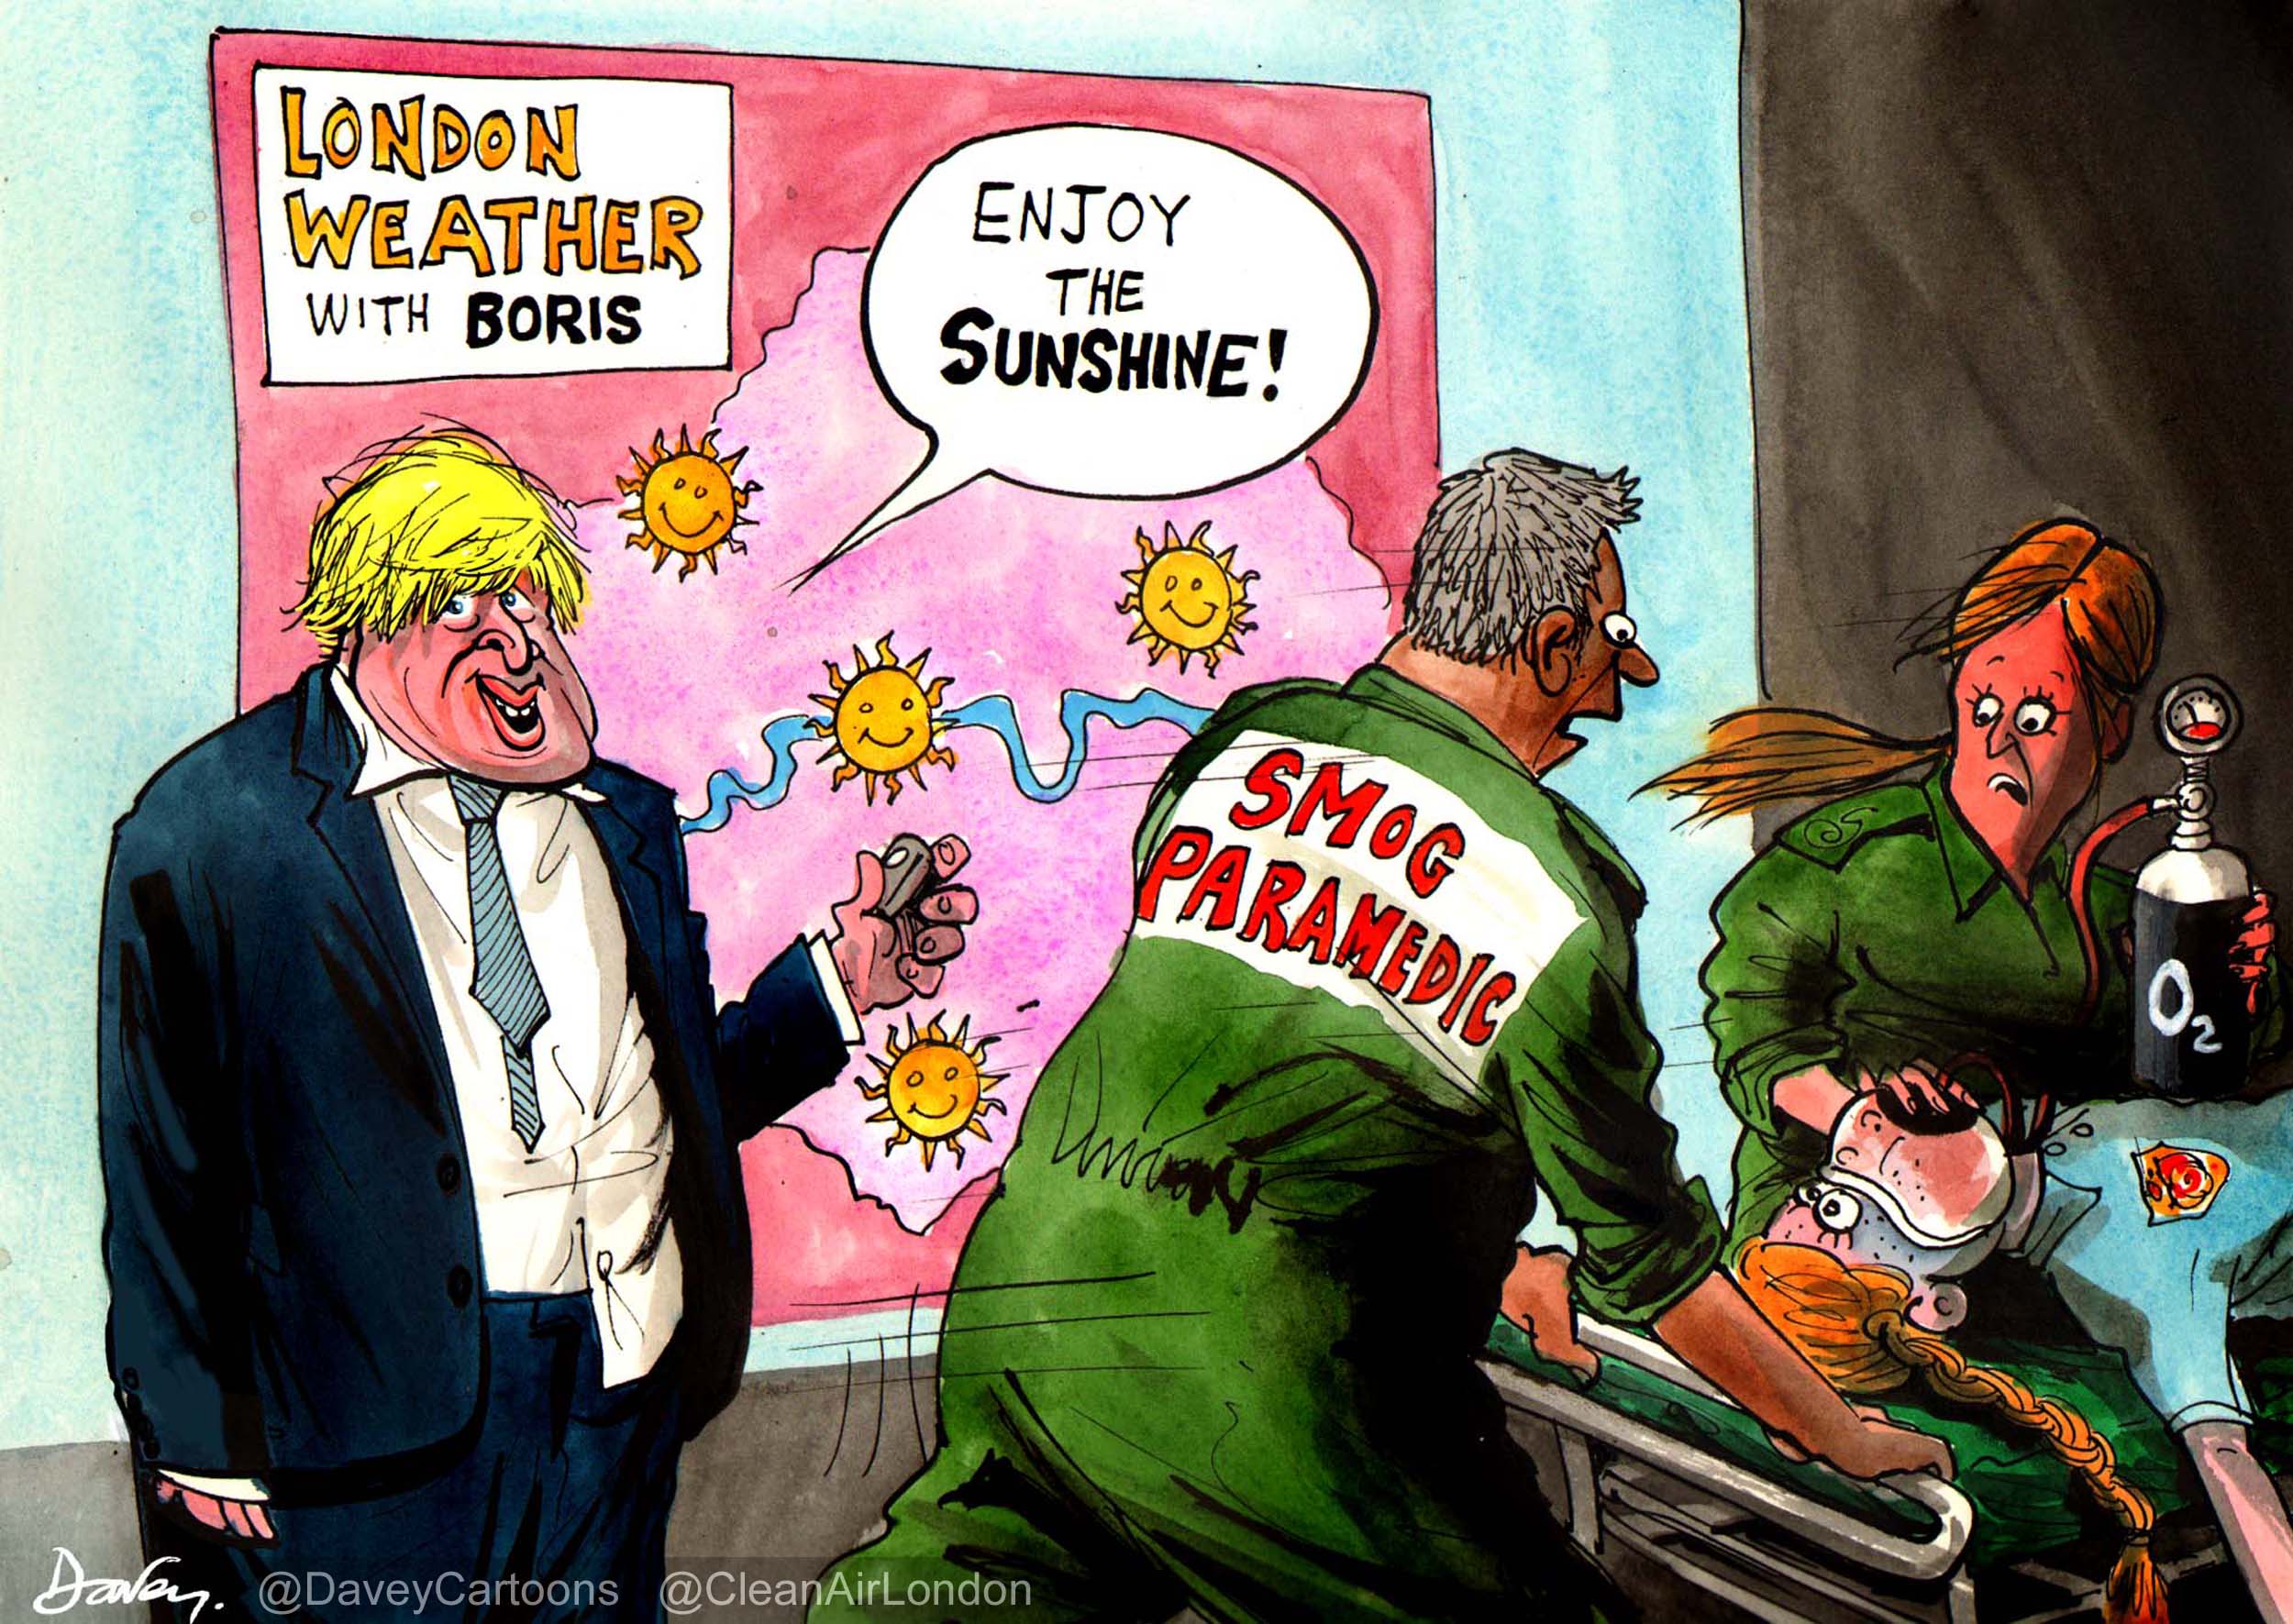
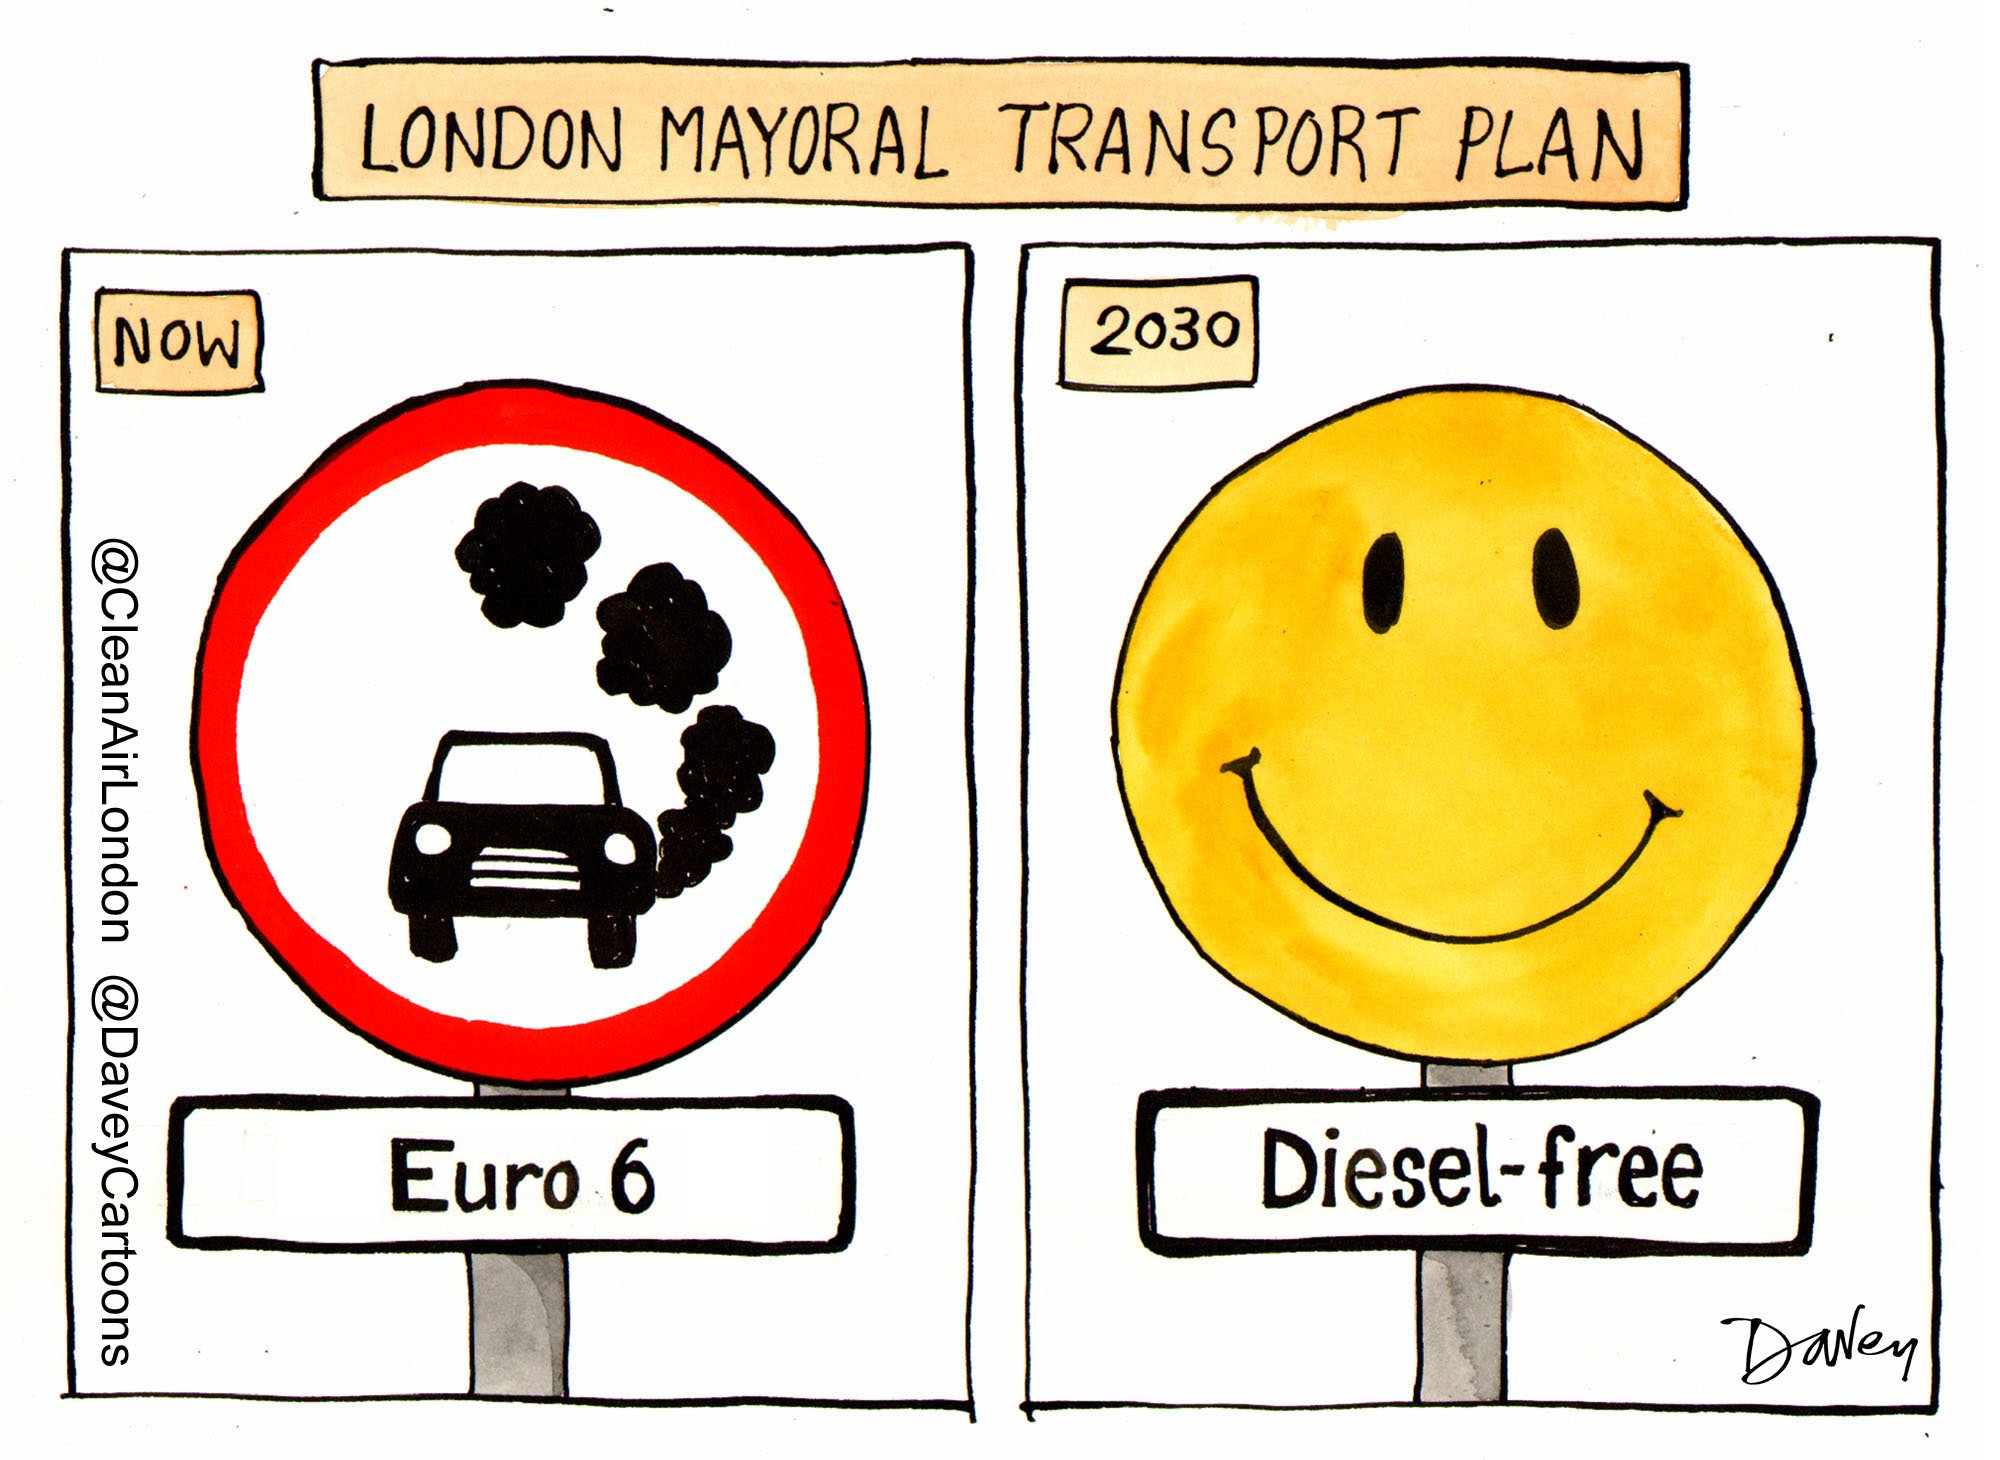
Boris Johnson must act in ‘Green Week’ in the ‘Year of Air’ after failing miserably to reduce air pollution
London again has the highest levels of nitrogen dioxide (NO2), a toxic gas, of any capital city in Europe according to the latest data published by the European Environment Agency (EEA)
Marylebone Road monitoring station ranked the third worst of 2,836 monitoring stations across the whole of Europe for NO2, falling from fourth worst in 2010. Nitrogen dioxide levels at sites in Glasgow and Camden, previously in the ‘Top 20’ worst in Europe, were unchanged but fell slightly in the rankings to 23rd and 25th respectively in 2011
London plummeted 346 places in the rankings for dangerous airborne particles (PM10) as the Marylebone Road monitoring station showed no improvement between 2010 and 2011 as other cities successfully reduced air pollution
Clean Air in London’s (CAL’s) analysis of the latest data from the European Environment Agency (EEA) confirms that London again had the highest levels of nitrogen dioxide (NO2), a toxic gas, of any capital city in Europe in 2011. London also plummeted 346 places in the rankings for dangerous airborne particles (PM10).
The authoritative EEA analyses data once it is formally reported by Member States which is nine months after the end of the previous calendar year. CAL has analysed the latest EEA data (i.e. 2011) which includes 2,836 monitoring stations for NO2 and 2,625 for PM10. Marylebone Road in London reported the third highest annual mean concentrations of NO2 at 97 mg/m3 behind individual sites in Florence (Italy) and Stuttgart (Germany). Marylebone Road ranked 341th worst for annual mean PM10 in 2011. The excellent London Air Quality Network (LAQN) shows other monitoring stations exceeding the levels reported for Marylebone Road e.g. Putney High Street in Wandsworth for NO2 and Neasden Lane in Brent and Horn Lane in Ealing for PM10 but the Government chooses not to report that data as those sites are not part of its official network.
The Mayor’s Air Quality Strategy in 2010 estimated computer modelled emissions for sources of key air pollutants (i.e. not concentrations). Road transport is the dominant source of PM10 emissions within central London contributing around 79% in 2008, 80% in 2011 and 75% in 2015. The most significant contributions from different vehicle types in 2008 were: cars 23%; taxis 25%; and light goods vehicles 10 to 20%. Around 35% of PM10 emissions from road transport in central London comes from tyre and brake wear. Other sources of PM10 emissions include boilers and gas combustion. Boris Johnson estimates road transport is the main source of PM2.5 emissions in London, contributing around 80% in 2008. Policy Exchange showed diesel vehicles are the biggest source by far.
For emissions of oxides of nitrogen (NOx) (which comprise NO2 and nitrogen monoxide), Boris Johnson estimates road transport and domestic gas (e.g. from cooking and heating) contributed 46% and 22% respectively in 2008. NOx emissions from commercial gas, industry, airports and rail are all estimated to contribute around 7 to 8% of emissions in 2008. Across Greater London, cars contribute the highest proportion of road transport emissions 35% whilst heavy goods vehicles are significant 30% and buses 21% (and just under 30% in 2015). Within central London buses become the most significant source of NOx emissions at around 40% in 2008 growing to just below 50% in 2015. Cars contribute around 20% as do HGVs and taxis and LGVs each contribute about 10% of emissions of NOx. Gas use from workplaces is more significant in central London, contributing around 30% in 2008.
The Mayor’s Air Quality Strategy forecast reductions between 2008 and 2011 in emissions of PM10 by 31% and NOx of 35% (pages 143 and 145 respectively). More recently, the Mayor has claimed that since 2008 emissions of PM10 and PM2.5 have been reduced by 15% and emissions of NOx have been reduced by 20% i.e. substantially less than expected Note 2. Even these reductions, if true, have done virtually nothing to improve measured air quality.
‘Green Week’ takes place this year in Europe between 4 and 7 June with the theme of ‘Air quality’ Note 4. Major announcements are expected from the Mayor and the European Commission.
Quotes
Simon Birkett, Founder and Director of Clean Air in London (CAL), said:
“London has reported again the highest levels of nitrogen dioxide (NO2), a toxic gas, of any capital city in Europe. According to the authoritative European Environment Agency (EEA), Marylebone Road had the third highest concentrations of NO2 of 2,836 monitoring sites across Europe in 2011.
“The Government does not report data from the worst sites in London such as Wandsworth (Putney High Street) and City of London (Walbrook Wharf) for NO2 and Brent (Neasden Lane) and Ealing (Horn Lane) for PM10. London plummeted 345 places in the rankings for PM10 between 2010 and 2011 after it showed virtually no improvement while other cities successfully reduced this deadly form of air pollution. The Government has stopped reporting data to the EEA for Cromwell Road which would show the impact on air pollution of the removal of the Western Extension of the Congestion Charging Zone.
“Research about real world emissions from diesel vehicles published recently by Kings College London and others showed that vehicle emissions have hardly reduced in the last 10 years. As clearly, the research showed there is no technology ‘silver bullet’ to eliminate carcinogenic diesel emissions. Even this month, we are seeing the Mayor’s policies failing with a dash for diesel vehicles to escape the congestion charge for another three years. There is no other answer – the Mayor must ban the most polluting diesel vehicles from the most polluted parts of London.
“The Mayor’s story on air pollution keeps getting confused by the facts. Concentrations of air pollutants, the true measure of success or failure, show London is failing miserably to address the biggest public health risk after smoking.
“The Mayor must act boldly in ‘Green Week’ in the ‘Year of Air’ if London is to lead the world again in tackling air pollution.”
ENDS
Notes
1. Mayor’s Air Quality Strategy, December 2010
http://www.london.gov.uk/sites/default/files/Air_Quality_Strategy_v3.pdf
2. Mayor announces air quality game changer, media release on 13 February 2013
3. Remote sensing of NO2 exhaust emissions from road vehicles, Carslaw et al 2013
4. Green Week: Cleaner air for all
5. London Air Quality Network statistics for monitoring sites
6. ‘Highest NO2 in Europe’ published 26 April 2012
https://cleanair.london/hot-topics/highest-no2-in-europe/
CAL 241 Report on EEA 2011 European data_010613 V2
CAL 241 EEA 2011 European data_London vs Basel 010613
CAL 241 EEA 2011 European data_London vs Zurich 010613
CAL 178_3_Report on trends in AQ in London and EU Comparison 240412

