ULEZ expansion is an important step on the path to phasing out diesel in London
ULEZ expansion targets the final group of diesel vehicles in the last part of London to achieve the Euro 6 emission standard and the comparable Euro 4 emission standard for petrol
Eight previous phases of Low Emission Zones, the T-Charge and Ultra Low Emission Zones have played a crucial part in reducing diesel in London over more than 15 years. This period has included the World Health Organisation (“WHO”) classifying diesel engine exhaust as carcinogenic to humans in June 2012 and ‘Dieselgate’ in September 2015
These steps have sharply reduced concentrations of nitrogen dioxide (“NO2”), a toxic gas, at roadsides to comply nearly with the WHO’s 2006 air quality guidelines and show how the new guidelines can be met by 2030
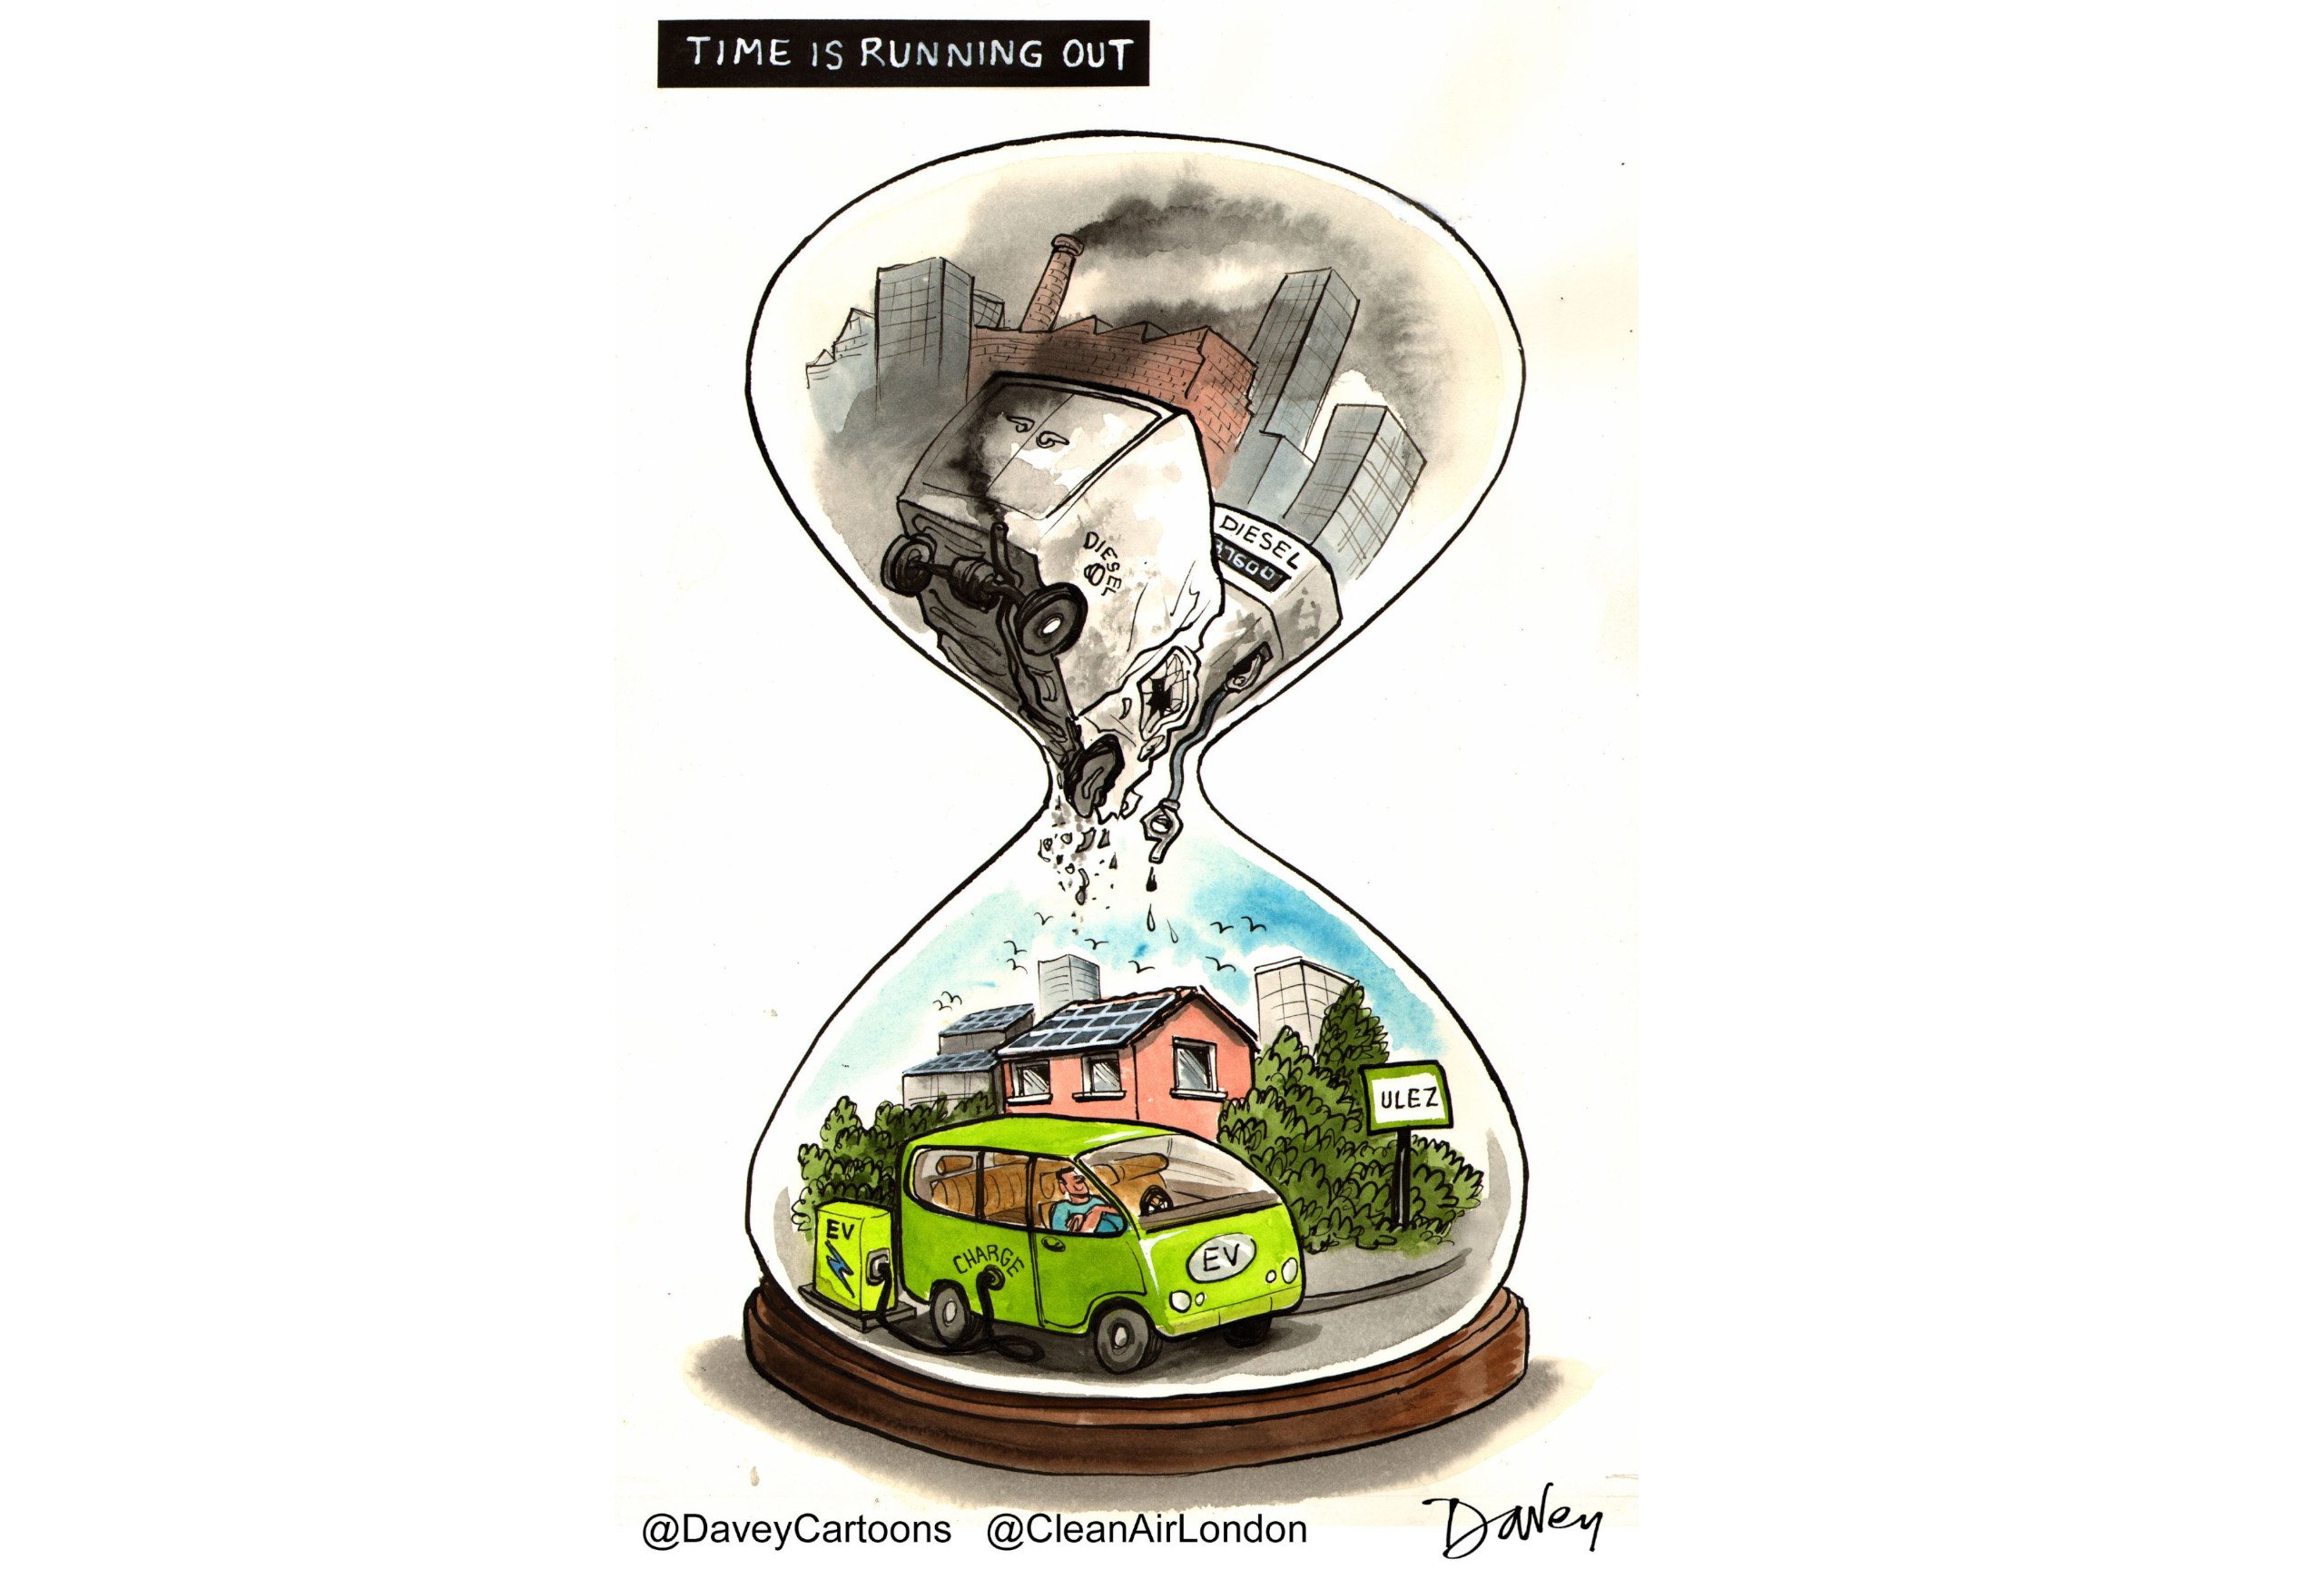
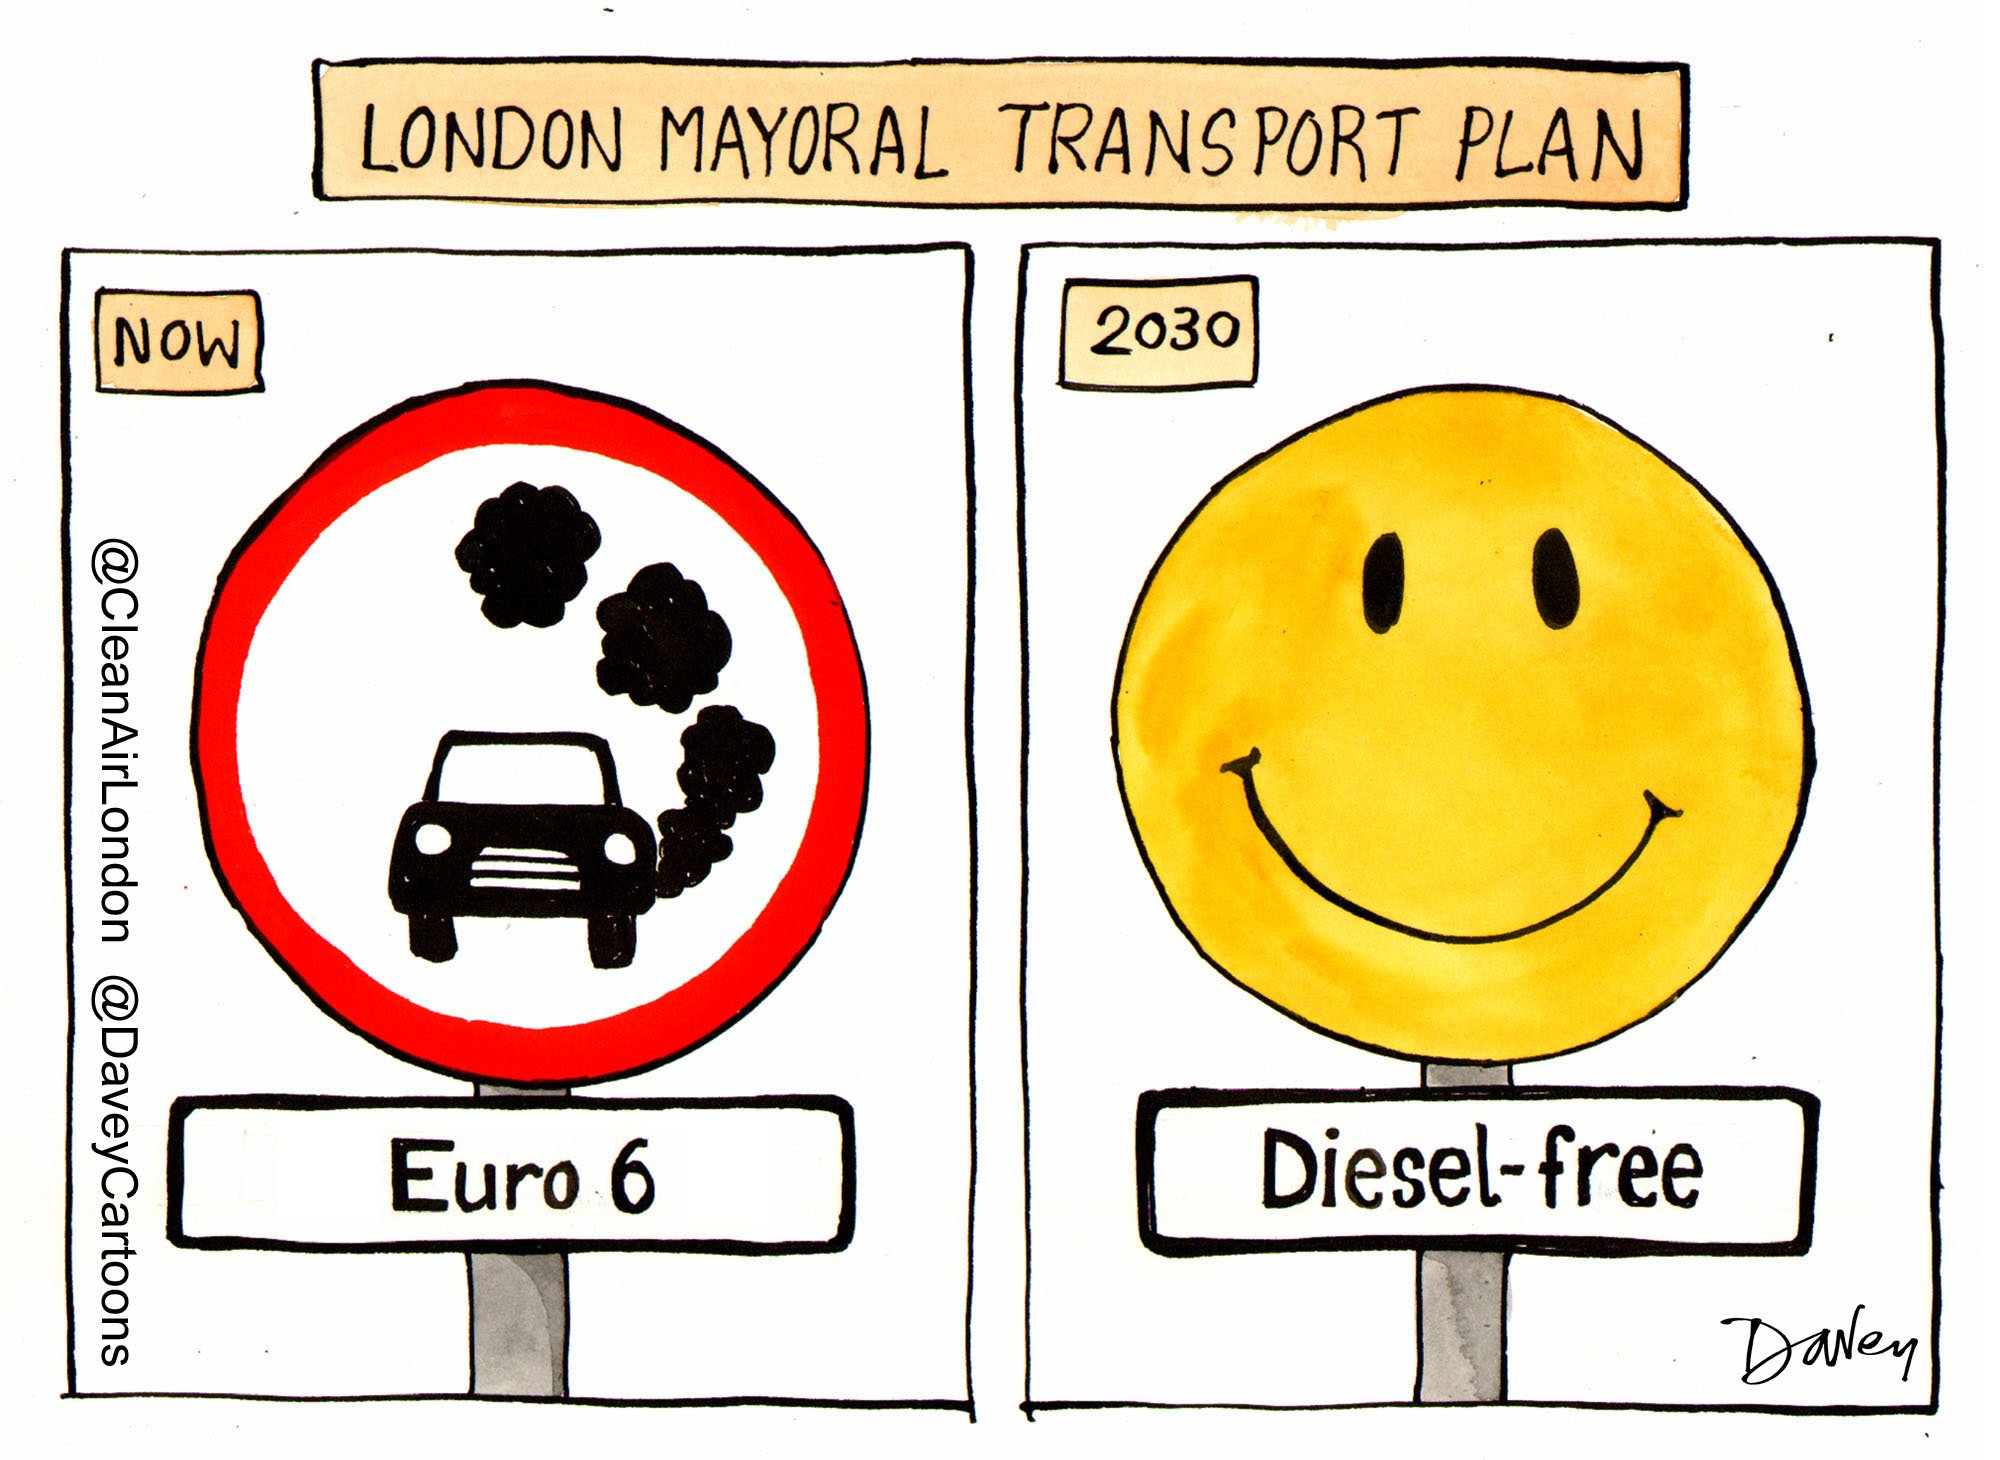
Candidates for Mayor of London in 2024 must encourage people to stop buying new diesel vehicles by setting a target for London to be ‘diesel-free’ by 2030 with limited exemptions
Air pollution is one of the world’s greatest environmental health risks and causes an estimated seven million premature deaths every year. The World Health Organisation (“WHO”) also names it as the second leading cause of deaths from non-communicable diseases after tobacco smoking.
The atmosphere comprises local air pollution and greenhouse gases. The former can be divided into particles – which are regulated for health and legal purposes by their diameter (e.g. “PM2.5” and “PM10”) – and gases. Nitrogen dioxide (“NO2”), a toxic gas, is an important molecule for these purposes within the cloud of gases. It also reacts with sunlight to form ozone, the most irritant gas known.
Vehicles are typically the largest source of NO2 at busy roadsides where the most vulnerable and economically deprived people often live. These roads are also the places where many people work, shop or travel including by public transport, walking or cycling. Other sources of NO2 include gas heating and cooking.
Low Emission Zones
NO2 from diesel vehicles was identified as a problem over 30 years ago. Powerful laws were put in place by 1999 to be achieved across Europe by 1 January 2010 with the possibility of time extensions of up to five years subject to strict conditions. ClientEarth successfully enforced these laws in the Supreme Court on 29 April 2015. Earlier deadlines addressed PM10.
By July 2014 a leading scientist explained that many roads in Central London would tend to have the highest NO2 concentrations in the world. Diesel vehicles were cited as a particular problem.
Measures to tackle traffic problems include two overlapping circles with one focused on congestion and the other focused on emissions. Each measure can have secondary benefits for the other. Low Emission Zones (“LEZs”), Toxicity Charges (“T-Charges”) and Ultra Low Emission Zones (“ULEZ”) target exhaust emissions. While these measures have successfully used technology to reduce harmful emissions at their source, they are also ‘blunt’ measures which could be replaced in due course by Emissions Based Road Charging (“EBRC”) which would charge people depending on the time and place they drive and the quality and quantity of fuel they burn. EBRC could pay people to walk and cycle. The technology exists to implement it and address privacy concerns.
Mayor Livingstone introduced the first LEZ for larger vehicles London-wide on 4 February 2008. It was extended to more vehicles on 7 July 2008 and tightened for two groups of vehicles on 3 January 2012. A fifth phase was implemented on 1 March 2021.
The WHO classified diesel engine exhaust as carcinogenic to humans on 12 June 2012, based on sufficient evidence that exposure is associated with an increased risk for lung cancer.
Ultra Low Emission Zones
On 26 March 2015, Mayor Johnson confirmed his plan for a ULEZ covering Central London from September 2020 that would require Euro 6 for diesel vehicles and Euro 4 for petrol vehicles or a daily charge of £12.50.
Air pollution was a top issue in the 2016 Mayoral election. Sadiq Khan was elected with a manifesto commitment to “restore London’s air quality to legal and safe levels…”. This led him to bring forward the date of the ULEZ to 8 April 2019 and announce a T-Charge, based on Euro 4 emission standards, for the same area from 23 October 2017 that would operate until the tighter ULEZ entered into force on 8 April 2019.
Mayor Khan was re-elected as Mayor on 6 May 2021 with a promise to expand the ULEZ to cover Inner London from 25 October 2021 and take “…even more world-leading action on tackling air pollution”.
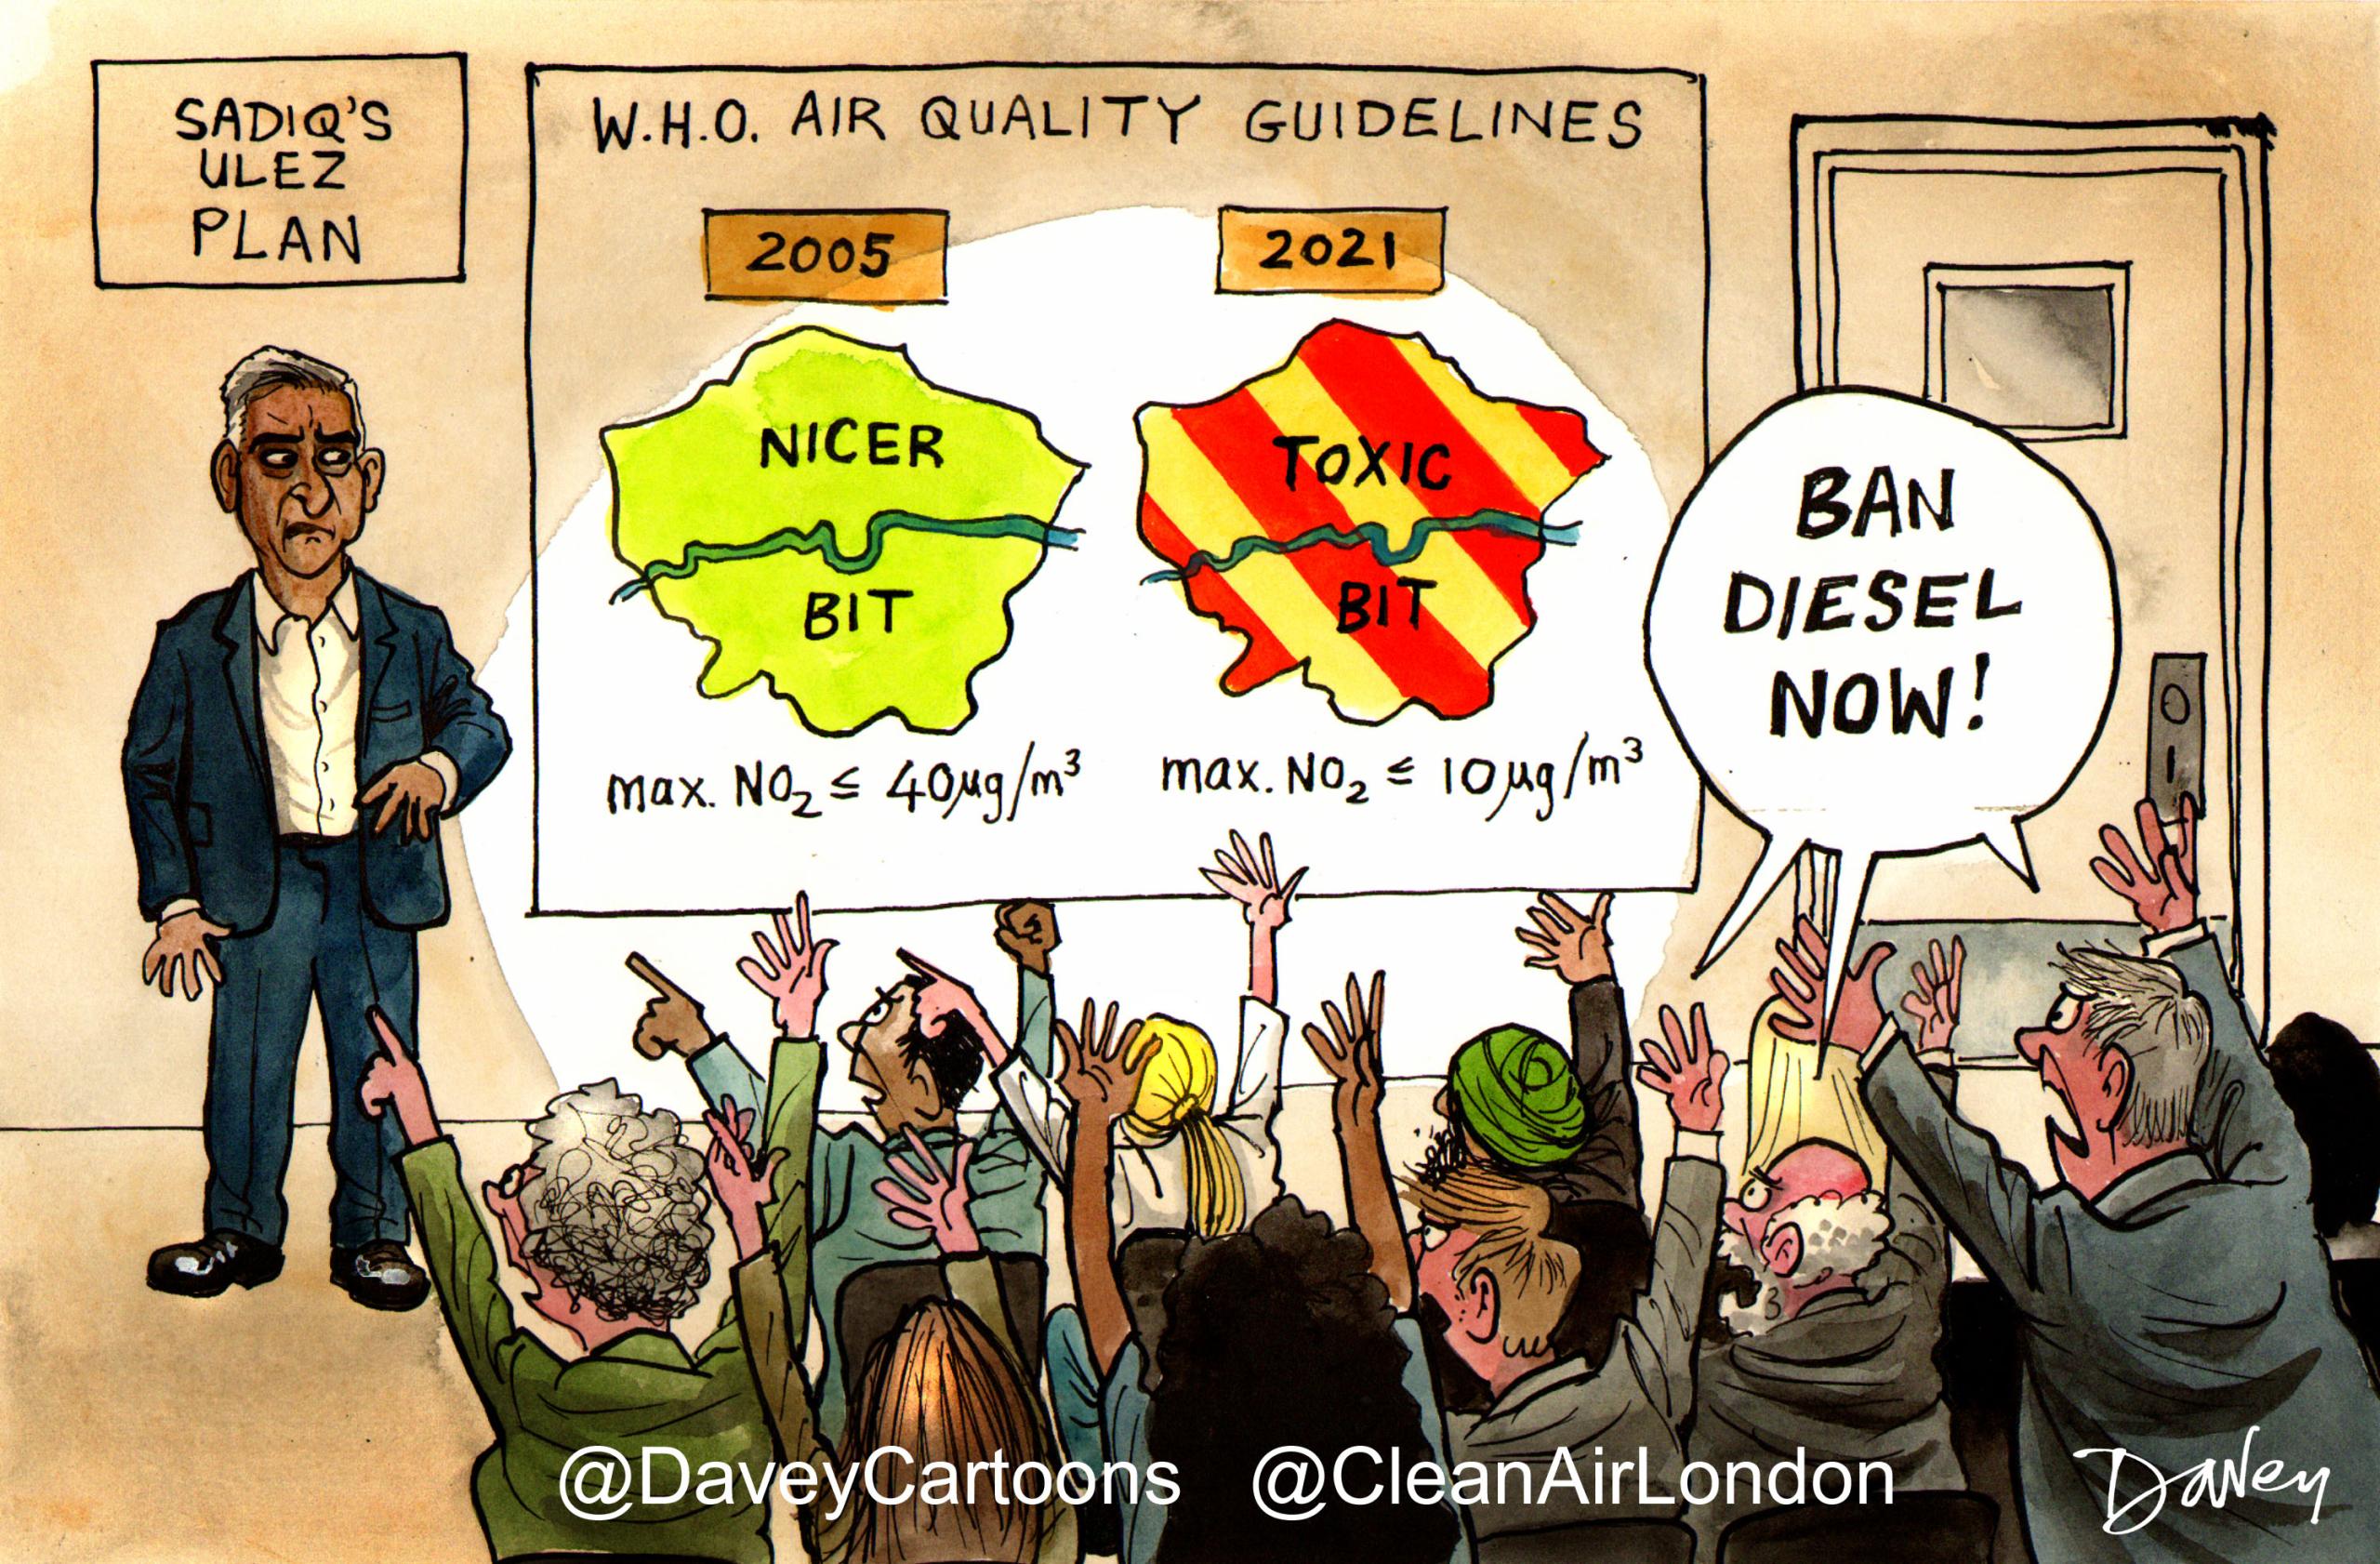
On 22 September 2021, the WHO published new air quality guidelines which halved the guideline for PM2.5 to 5 micrograms per cubic metre (ug/m3) and slashed the equivalent for NO2 from 40 ug/m3 to 10 ug/m3 with an interim target of 20 ug/m3. The new guidelines were informed by a series of systematic reviews investigating associations between a range of air pollution and human health outcomes over many years.
These new guidelines will inevitably have contributed, alongside other factors, to Mayor Khan’s decision to consult between 20 May 2022 and 29 July 2022 on proposals to expand the ULEZ to Outer London and confirm his decision on 25 November 2022 to proceed on 29 August 2023.
Reducing exhaust emissions to protect public health
Emission measures typically target one or more pollutants from one or more sources in one or more places over one or more time periods. Their impact may occur over many months e.g. due to pre-compliance, decisions and lead-times to purchase new or second-hand vehicles, the timing of scrappage or retrofitting schemes or possible periods of ‘soft’ enforcement.
Jacobs’ Integrated Impact Assessment (dated 17 May 2022) for Transport for London (“TfL”) estimated that ULEZ expansion would reduce road traffic NOx emissions from cars and motorcycles (which are the subject of ULEZ expansion) by between 7.3% and 11.4% in boroughs new to the scheme in Outer London by the end of 2023 (Appendix D, Table 9-1). The same report showed the number of people exposed to concentrations of NO2 exceeding the WHO’s interim target (of 20 ug/m3) being reduced by between 4.5% and 14.4% in most boroughs new to the scheme in Outer London by the end of 2023 (Appendix D, Table 9-6) i.e. 342,700 people. NO2 concentrations fall sharply away from roadsides.
The consultation document for ULEZ expansion (dated May 2022) estimated that with a London-wide ULEZ in place, 145 (of 2,369) schools (mostly in outer London), 30 (of 335) care homes and 13 hospitals (of 228) are expected to meet the WHO’s interim target of 20 ug/m3 for NO2 by the end of 2023 (pages 72 to 74).
The ULEZ has been highly successful at reducing NO2 concentrations in Central and Inner London. The Mayor of London’s first year report on the Inner London expansion estimated that it reduced NO2 at roadsides in these areas by over 40% and 20% respectively. The ULEZ was also shown to have reduced PM2.5 and carbon dioxide emissions. Other and related measures, such as the increasing electrification of the bus and taxi fleets in London, have contributed to further reductions of NO2 and other pollutants.
Low emission zones have been shown to reduce hospitalisations, heart attacks and strokes. A separate study by the UK Health Security Agency (“UKHSA”), formerly Public Health England, has estimated 1,140,018 new cases of disease attributable to nitrogen dioxide between 2017 and 2035 equivalent to 1,933 new cases of disease per 100,000 population.
Next steps
After a landmark High Court decision on 28 July 2023, the ULEZ will expand to Outer London on 29 August 2023. This means that up to 10% of cars seen driving in Outer London on an average day will need to pay a daily charge of £12.50.
Quotes
Simon Birkett, Founder and Director of Clean Air in London, commented:
“The case for improving London’s air quality is clear. Air pollution is one of the world’s greatest environmental health risks causing an estimated seven million premature deaths every year. The World Health Organisation also names it as the second leading cause of deaths from non-communicable diseases after tobacco smoking.
“This isn’t the end of the story. ULEZ expansion represents an important step on the path to phasing out diesel in London and showing how the WHO’s new air quality guidelines can be met by 2030. We’re witnessing the evolution of a policy that has shown its worth across eight successive schemes to reduce diesel exhaust emissions and protect public health. As a next step, candidates for the Mayor of London in 2024 must encourage people to stop buying diesel vehicles by setting a target for London to be ‘diesel-free’ by 2030 with limited exceptions.
“We know that low emission zones work. The Mayor of London has shown that two earlier phases of the ULEZ in Central London and Inner London have dramatically reduced NO2 concentrations along roadsides by over 40% and 20% respectively. These roadsides are where the most vulnerable and economically deprived people often live and many others work, visit or travel from time to time. Significantly, the number of diesel cars first registered in London has fallen by over 90% since the peak in 2015 and 2016 to 5,386 in 2022.
“The greatest lesson from the Great Smog, more than 70 years ago, is that big problems need big solutions. ULEZ expansion will create the biggest, strongest ultra low emission zone in the world and make London a world leader in cleaner air again.
“Megacities need a mixture of political leadership, technology and ‘lifestyle measures’ to tackle their biggest problems such as air pollution and climate change. Of these, ‘lifestyle measures’ range from bans, charges and campaigns to build public understanding of air pollution to incentives and adoption. They also encourage walking, cycling and the use of public transport.
“The latest phase of the ULEZ targets the final group of diesel vehicles in the last part of London to achieve the Euro 6 engine emission standard and the comparable Euro 4 standard for petrol vehicles. These standards aim to reduce exhaust emissions of oxides of nitrogen to reduce concentrations of nitrogen dioxide at roadsides and make the air more breathable, especially for those living in congested areas.
“While diesel is a particularly serious problem in Europe, that requires large strong ultra low emission zones, ULEZ expansion in London has valuable lessons for other cities around the world.”
ENDS
Short additional quote:
“ULEZ expansion highlights the need for big solutions to tackle big environmental problems. In particular, it shows the need to combine the best technology, in the form of the latest emission standards, and regulatory or ‘lifestyle’ measures – such as daily charging, scrappage funds and incentives – to reduce air pollution in the most polluted places. After eight major emissions schemes, over more than 15 years, London is successfully encouraging people to stop buying diesel vehicles, with only 5,386 diesel cars first registered in London in 2022.”
Notes
1. Timeline
31 January 2006 Consultation begins on Low Emission Zone “(LEZ”)
13 November 2006 Consultation begins on detailed proposals for London-wide LEZ (until 2 February 2007)
4 June 2007 Countdown to London-wide LEZ begins
4 February 2008 LEZ commences London-wide
7 July 2008 LEZ phase 2 commences
3 February 2009 Mayor Johnson suspends third phase of LEZ due to affect vans and minibuses from October 2010
3 January 2012 LEZ phases 3 and 4 commence
12 June 2012 International Agency for Research on Cancer classified diesel engine exhaust as carcinogenic to humans
https://www.iarc.who.int/wp-content/uploads/2018/07/pr213_E.pdf
9 July 2014 Leading scientist says there are reasons to believe many roads in central London will tend to have the highest NO2 concentrations of anywhere
https://www.londonair.org.uk/london/asp/news.asp?NewsId=OxfordStHighNO2&StartIndex=31
26 March 2015 Mayor Johnson announces world’s first Ultra Low Emission Zone (“ULEZ”) for September 2020 i.e. Central London (136,000 residents) (21 square kilometres)
https://www.london.gov.uk/press-releases/mayoral/ultra-low-emission-zone
29 April 2015 Supreme Court orders Government to submit a new air quality plan for nitrogen dioxide by no later than 31 December 2015
https://cleanair.london/legal/major-victory-for-clientearth-enforcing-nitrogen-dioxide-laws/
September 2015 Dieselgate emissions scandal begins
https://en.wikipedia.org/wiki/Volkswagen_emissions_scandal
5 May 2016 London Mayoral election
17 February 2017 Mayor Khan confirms Emissions Charge (“T-Charge”) in Central London from
23 October 2017
https://www.london.gov.uk/press-releases/mayoral/mayor-introduces-10-toxicity-charge
23 October 2017 T-Charge commences in Central London
https://tfl.gov.uk/info-for/media/press-releases/2017/october/mayor-s-new-10-t-charge-starts-today
3 November 2017 Mayor Khan confirms ULEZ will start earlier on 8 April 2019
https://www.london.gov.uk/press-releases/mayoral/ulez-will-start-in-2019-to-tackle-toxic-air
8 June 2018 Mayor Khan confirms ULEZ extension to north/south circular from 25 October 2021 i.e. Inner London (123 square miles (319 square kilometres)) (3,404,300 people) (2021 census)
https://www.london.gov.uk/press-releases/mayoral/ultra-low-emission-zone-to-expand
8 April 2019 ULEZ starts in Central London (24/7/365)
https://www.london.gov.uk/press-releases/mayoral/ulez-launches-in-central-london
1 March 2021 Low Emission Zone tightened to require all larger commercial vehicles to meet the Euro VI emission standard
https://tfl.gov.uk/modes/driving/low-emission-zone
6 May 2021 London Mayoral election
25 October 2021 ULEZ expands to north-south circular. New zone covers 380 square kilometres (i.e. 18 times the size of Central London) and covers 3.8 million people
https://www.london.gov.uk/press-releases/mayoral/ultra-low-emission-zone-covers-all-of-inner-london
25 November 2022 Mayor Khan announces ULEZ expansion London-wide from 29 August 2023
https://www.london.gov.uk/ultra-low-emission-zone-will-be-expanded-london-wide
28 July 2023 Landmark High Court judgment dismisses legal challenge
https://www.judiciary.uk/judgments/london-borough-of-hillingdon-v-mayor-of-london/
29 August 2023 ULEZ will extend to Outer London (484 square miles (1,253 square kilometres) (5,395,000 people) (2021 census)
2 May 2024 London Mayoral election
Other Mayoral press releases
https://tfl.gov.uk/info-for/media/press-releases
https://www.london.gov.uk/media-centre/mayors-press-releases
2. Guide to vehicle emission and congestion measures – Check TfL website for latest information
ULEZ (24/7/364 days) First registered
Euro 3 (NOx) motorcycles, mopeds etc Widely available since 2007
Euro 4 (NOx) petrol cars, vans and (some) minibuses Widely available since 2006
Euro 6 (NOx and PM) diesel cars, vans and minibuses Widely available since 2016
Euro VI (NOx and PM) diesel HGVs, vans etc (>3.5 tonnes) January 2014
Euro VI (NOx and PM) diesel buses, minibuses and coaches (>5 tonnes) January 2014
Congestion charge (except Christmas Day to New Year’s Day bank holiday inclusive)
Operates 07:00 to 18:00 Monday to Friday
Operates 12:00 to 18:00 Saturday, Sunday and Bank Holidays
3. ULEZ resources
TfL – ULEZ consultation documents and reports
CAL 526 ULEZ consultation document_May 2022
ULEZ – Year One report (18 February 2023)
CAL 526 Inner London ULEZ One Year Report – final
Scrappage scheme. NB: Eligibility expanded on 21 August 2023
Mayor announces extension of scrappage scheme from 21 August 2023 (on 4 August 2023)
4. TfL consultations
https://haveyoursay.tfl.gov.uk/cleanair
London-wide ULEZ Integrated Impact Assessment (Jacobs: 17 May 2022)
Estimated changes in NOx emissions in London boroughs (Table 9-1, pages 155 and 156, Appendix d) (cars and motorcycles)
Population exceeding WHO air quality target for annual mean NO2 concentration 20 ug/m3 in London boroughs (Table 9-6, pages 167-170, Appendix D)
Evening Standard: Poll shows clear support for expanding ULEZ (11 October 2022)
5. London Atmospheric Emissions Inventory 2019
CAL 526 LAEI 2019 Summary Note_April 2023
LAEI Summary Note (24 April 2023): Figures 7 and 8 highlight the importance of exceedances along roadsides (pages 15 and 16)
LAQN: Oxford Street – highest NO2 concentrations in the world? (9 July 2014)
“…there are reasons to believe many roads in central London will tend to have the highest NO2 concentrations of anywhere.”
https://www.londonair.org.uk/london/asp/news.asp?NewsId=OxfordStHighNO2&StartIndex=31
6. Clean Air Zones
https://www.gov.uk/guidance/driving-in-a-clean-air-zone
https://www.gov.uk/government/news/public-health-england-publishes-air-pollution-evidence-review
https://uk-air.defra.gov.uk/library/no2ten/
CAL 526_3_Defra_aq-plan-2015-overview-document
7. Health
Word Health Organisation announced new air quality guidelines on 22 September 2021
https://cleanair.london/hot-topics/new-who-air-quality-guidelines/
Nitrogen dioxide (NO2):
Annual mean guideline: 10 ug/m3
Interim target: 20 ug/m3
Daily mean guideline: 25 ug/m3 (3-4 exceedances per year)
NO2 is a reddish-brown gas and a strong oxidant. It is also an important ozone precursor. Ozone is the most irritant gas known
Short-term exposure can cause inflammation of the airways and increase susceptibility to respiratory infections and allergens. It can also exacerbate the symptoms of those already suffering from lung and heart conditions.
https://www.who.int/health-topics/air-pollution#tab=tab_1
WHO fact sheet about ambient (outdoor) air pollution (19 December 2022)
Worldwide ambient air pollution in 2019 accounted for:
43% of deaths and disease from chronic obstructive pulmonary disease
25% of deaths and disease from ischaemic heart disease
24% of deaths from stroke
17% of deaths and disease from acute lower respiratory infection
29% of deaths and disease from lung cancer
Update of the WHO Air Quality Guidelines: Systematic Reviews (1 October 2022)
Non-communicable diseases
“Air pollution is the second leading cause of deaths from non-communicable diseases (“NCDs”) after tobacco smoking.”
“The WHO recognises household and ambient air pollution as one of five key risk factors for NCDs, along with unhealthy diets, tobacco-smoking, harmful use of alcohol and physical inactivity.”
https://www.who.int/news-room/fact-sheets/detail/noncommunicable-diseases
https://www.who.int/health-topics/noncommunicable-diseases#tab=tab_1
UNECE: Air pollution and health
European Environment Agency: Air pollution and health
Inquest touching on the tragic death of Ella Roberta Adoo Kissi-Debrah (16 December 2020)
Chief Medical Officer’s annual report on Air Pollution (8 December 2022) (page ii)
“Some individuals such as those with pre-existing respiratory or cardiovascular disease are particularly susceptible, but the effects of air pollution can be seen across the population. The mortality burden of air pollution in England is estimated to be between 26,000 and 38,000 a year, but in addition many people suffer avoidable chronic ill health as a result of it. Improvements in air quality have been associated with improved health outcomes – for example, reductions in air pollution in London have led to reduced childhood asthma hospital admissions. Further reductions in air pollution will lead to significant reductions in coronary heart disease, stroke and lung cancer, among others.”
COMEAP statement on quantifying mortality associated with long-term exposure to PM2.5 (16 March 2022) (which recommended increasing the CRF from 6% to 8% per 10 ug/m3)
COMEAP report on the link between long-term average concentrations of nitrogen dioxide and mortality (22 August 2018)
https://www.gov.uk/government/publications/nitrogen-dioxide-effects-on-mortality
21 December 2010 (paragraphs 18 and 21 on page 5)
“As a central estimate we conclude that anthropogenic PM2.5 at 2008 levels (8.97 µg/m3 in the UK) is associated with an effect on mortality equivalent to nearly 29,000 deaths at typical ages of death in 2008 in the UK…”
“It is not known how this population-wide burden is spread across individuals in the population, but we can speculate between various possibilities. Our results are consistent with an average loss of life ranging at one extreme from 11½ years if air pollution was solely responsible for 29,000 deaths to, at the other extreme, six months if the timing of all deaths was influenced by air pollution. We believe both of these extremes to be extremely unlikely. Given that much of the impact of air pollution on mortality is linked with cardiovascular deaths, it is more reasonable to consider that air pollution may have made some contribution to the earlier deaths of up to 200,000 people in 2008, with an average loss of life of about two years per death affected, though that actual amount would vary between individuals. However, this assumption remains speculative.”
Six Cities Study – 9 December 1993
IARC – 12 June 2012
Public Health England: Health matters: air pollution – 14 November 2018
Imperial College London (25 January 2021) – Between 3,600 and 4,100 attributable deaths in 2019 (anthropogenic PM2.5 and NO2) (Table 3, page 16). Note: 2,955 attributable deaths for anthropogenic PM2.5 alone (Table 5, page 20) and 2,999 attributable deaths for NO2 (Table 6, page 21)
“In 2019, in Greater London, the equivalent of between 3,600 to 4,100 deaths (61,800 to 70,200 life years lost) were estimated to be attributable to human-made PM2.5 and NO2, considering that health effects exist even at very low levels. This calculation is for deaths from all causes including respiratory, lung cancer and cardiovascular deaths.” (Key findings, page 3).
CAL 526 ERG_ImperialCollegeLondon_HIA_AQ_LDN_11012021
Other studies or reports by Imperial College London
https://www.london.gov.uk/sites/default/files/hia_asthma_air_pollution_in_london.pdf
https://www.imperial.ac.uk/news/231894/london-pollution-improved-with-evidence-small/
https://iopscience.iop.org/article/10.1088/1748-9326/ac30c1
UK Health Security Agency (June 2022) (29,000 to 43,000 attributable deaths in the UK in 2019) (Table 4, pages 15 to 21)
“An estimate of the mortality burden attributable to long-term exposure to air pollution is useful in communications about the public health significance of air pollution.
The Committee on the Medical Effects of Air Pollutants (COMEAP) recently updated its recommendation for quantification of mortality associated with long-term exposure to fine particle air pollution (PM2.5). The recommended concentration-response function (CRF) is 1.08 (95% CI: 1.06, 1.09) per 10μg/m3 annual average PM2.5. The use of a cut-off value is not recommended when quantifying the mortality burden and thus quantification can be carried out down to very low PM2.5 concentrations by assuming a log-linear shape for the CRF.
We applied the method developed by COMEAP to estimate the mortality burden associated with long-term exposure to air pollution using the updated CRF. Using this approach, the mortality burden associated with exposure to the air pollution was estimated for the UK and separately for the 4 constituent nations. The new estimates suggest that the burden of long-term exposure to air pollution in 2019 in the UK was an effect equivalent to 29,000 to 43,000 deaths for adults aged 30 and over.”
“In the UK, using single-pollutant models for NO2 or PM2.5 as indicators of the air pollution gave estimates of 19,000 and 40,000 respectively; the 2 estimates should not be added together, but the higher of these should be used, as this is likely to underestimate the burden the least. By using the pairs of adjusted coefficients from the 4 different studies, the values range from 29,000 to 43,000. This encompasses the estimate based on the use of the single pollutant model for PM2.5 and represents the burden of long-term exposure to air pollution.”
Note: England – 26,000 to 38,000 attributable deaths
6.5% in London in 2021.
LEZs health benefits (July 2023)
“Available evidence suggests observable health benefits from schemes restricting private vehicles in cities. Evidence for LEZs is most consistent for cardiovascular disease, whereas evidence for CCZs is restricted to RTIs [road traffic injuries] in London. Further research could usefully investigate how to optimise the design of such schemes to improve health.”
Useful Parliamentary Questions
PQ UIN185745 (18 May 2023) re new cases of disease for NO2 and PM2.5 between 2017 and 2035
PQ UIN 181819 (19 April 2019) re emissions become concentrations
PQ UIN 181810 (19 April 2023) re classifications of deaths
Official letter explaining death statistics
PQ UIN 185732 (18 May 2023) re total PM2.5
PQ UIN 185872 (19 May 2023) re 48,592 deaths in London in 2022 (aged 30 and above) (excluding COVID-19) (2019: 47,878; 2020: 48,623; and 2021: 46,265)
CAL 526 PQ185870_185871_185872
PQ UIN 183299 (2 May 2023) re 12,937 deaths by cardiovascular causes in London in 2021 (2019: 12,612; and 2020: 12,838)
29 August 2023 was the 241st day of the year.
8. Population weighted total PM5 was 8.6987 ug/m3 in London in 2021
https://uk-air.defra.gov.uk/data/pcm-data
9. High Court judgment – 28 July 2023
Bexley, Bromley, Harrow, Hillingdon and Surrey vs Mayor of London
“The Councils’ challenge fails on all three grounds and is dismissed.”
10. Nitrogen dioxide levels (calendar year 2022) – Site type (roadside, background etc). E&OE
Notes:
- Full year data takes account of seasonal changes e.g. winter heating emissions
- WHO interim level and expected new European Union legal limit for NO2 is 20 mg/m3
Barking and Dagenham, Scrattons Farm (Suburban). 2022: 21 ug/m3
Barnet, Tally Ho (Urban traffic). 2022: 29 ug/m3
Bexley, Slade Green (Suburban). 2022: 18 ug/m3
Brent Park Ikea, Drury Way (Roadside). 2022: 43 ug/m3
Bromley, Harwood Avenue (Roadside). 2022: 20 ug/m3
Croydon, Norbury (Kerbside). 2022: 37 ug/m3
Ealing, Alec Reed Academy (sensor) (Urban traffic). Only 2023 YTD available (22/8/23): 33 ug/m3
Enfield, Bush Hill Park (Suburban). 2022: 19 ug/m3
Greenwich, Fiveways Sidcup Road A20 (Roadside). 2022: 27 ug/m3
Havering, Romford (Roadside). 2022: 30 ug/m3
Harrow, Stanmore (Urban background). Latest FY data 2021: 16 mg/m3. 2023 YTD: 12 ug/m3
Hillingdon, Keats Way (Suburban). 2022: 27 ug/m3
Kingston upon Thames, Cromwell Road (Roadside). 2022: 43 ug/m3
Merton, Morden Civic Centre 2 (Roadside). Last FY data 2019: 51 mg/m3. 2023 YTD: 30 ug/m3
Sutton, Wallington (Kerbside). 2022: 44 ug/m3
Tower Hamlets (Roadside). 2022: 24 ug/m3
Waltham Forest, Crooked Billet (Urban traffic). 2022: 40 ug/m3
Other sites
Brixton Road, Lambeth (Kerbside). 2022: 64 ug/m3
Wandsworth, Putney High Street (Kerbside). Last FY data 2021: 62 mg/m3. 2023 YTD: 32 ug/m3
11. Clean Air in London research
‘Blame Maggie Thatcher and every Prime Minister since for diesel’ (4 May 2017)
‘Emissions Based Road Charging’ (15 June 2015)
‘Ultra Low Emission Zones‘ (6 April 2019)
12. Failure of diesel standards
Limited impact of diesel particle filters on road traffic emissions of ultrafine particles (April 2023)
https://www.transportenvironment.org/discover/diesel-true-dirty-story/
Clean Air Fund – End of programme report FINAL (January 2013) (Table 2: Comparison of Clean Air Measures e.g. diesel particle filters versus green infrastructure)
https://cleanair.london/olympics/mayor-used-pollution-suppressor-to-save-himself-not-others/
13. Diesel cars first registered in London (i.e. in a city of nine million people)
Cars Vans
2011 49,875
2012 55,012
2013 59,122
2014 67,107
2015 68,681 15,325
2016 68,841 14,643
2017 56,282 14,446
2018 13,534
2019 13,321
2020 8,708
2021 7,595 11,706
2022 5,386 6,787
https://www.smmt.co.uk/vehicle-data/car-registrations/
PQ UIN 139131 (3 February 2023) re cars first registered in 2017 and 2021
PQ UIN 183302 (2 May 2023) re cars first registered in 2016 and 2022 (9 months)
PQ UIN 185865 (19 May 2023) re cars first registered in 2011, 2012, 2013, 2014 and 2015
What Do They Know (13 July 2023) re cars first registered in 2022
Mayoral Questions (23 March and 18 May 2023)
14. Urban access regulations in other cities
https://urbanaccessregulations.eu/
https://londonair.org.uk/london/asp/LAQNSeminar/pdf/september2010/Berlin_LEZ_impacts_analysis.pdf
15. Ella’s Law – Clean Air (Human Rights) Bill
https://cleanair.london/ellaslaw/
https://bills.parliament.uk/bills/3161
https://cleanair.london/app/uploads/CAL-455-UNGA-R2HE-resolution-adopted-280722.pdf
European Commission proposals (26 October 2022): Press release and Annex
16. Sadiq Khan, Mayoral manifesto commitments
May 2016 – My priorities (page 8)
“Restore London’s air quality to legal and safe levels…”
May 2021
“I promise even more world-leading action on tackling air pollution.”
“I’ll expand the ULEZ in October 2021…”
“Beyond expansion of the ULEZ, I’ll monitor all existing road-charging schemes to ensure they bring the maximum benefits of improved air quality and reduced congestion, and I’ll identify where further action is needed to eradicate hotspots for air pollution.”
17. Conservative Party manifesto commitments (2019)
“We will support clean transport to ensure clean air, as well as setting strict new laws on air quality.”
18. Great Smog (5-9 December 1952)
https://cleanair.london/health/great-smog/ (16 November 2022)
19. Environmental Audit Committee inquiry (launched on 10 May 2023)
The Environmental Audit Committee has an ongoing inquiry into outdoor and indoor air quality targets.
https://committees.parliament.uk/work/7686/outdoor-and-indoor-air-quality-targets/
20. Other
https://www.healtheffects.org/
https://cleanair.london/app/uploads/City-of-London_VP_Act-1954-2.pdf
21. Media coverage
From 12:50 mark: https://www.bloomberg.com/news/audio/2023-08-29/bloomberg-uk-politics-cleverly-in-china-podcast

