House of Commons Environment Food and Rural Affairs Committee
Reply to the call for evidence submitted by Clean Air in London
6 June 2012 (links to four Guides updated 250612)
Evidence submitted ahead of oral evidence session on air quality
Introduction
1. The House of Commons Environment Food and Rural Affairs (EFRA) Committee has invited written evidence on the subject of air quality prior to holding an oral evidence session. Clean Air in London (CAL) is pleased to respond to this call for evidence.
2. CAL is a cross-party not for profit organisation with a mission that includes campaigning to achieve urgently and sustainably full compliance with World Health Organisation (WHO) guidelines for air quality throughout London. CAL is independent of Government funding and funded instead by donations and sponsors such as Camfil Farr, the world leader in the development and manufacture of air filters for buildings. Further details about CAL can be seen at: http://cleanair.london/
3. CAL has written four articles for Politics Home in 2012 which aim to provide an introduction to air pollution issues in the London and the UK. Fuller versions of these articles appear on the new CAL website and links to them are included here for convenience:
Health: ‘Invisible’ air pollution: the biggest public health failing or ‘cover-up’ for decades
Legal: UK is cheating on air quality laws and misleading the European Commission
Sources: London has the highest levels of nitrogen dioxide, a toxic gas, of any capital city in Europe
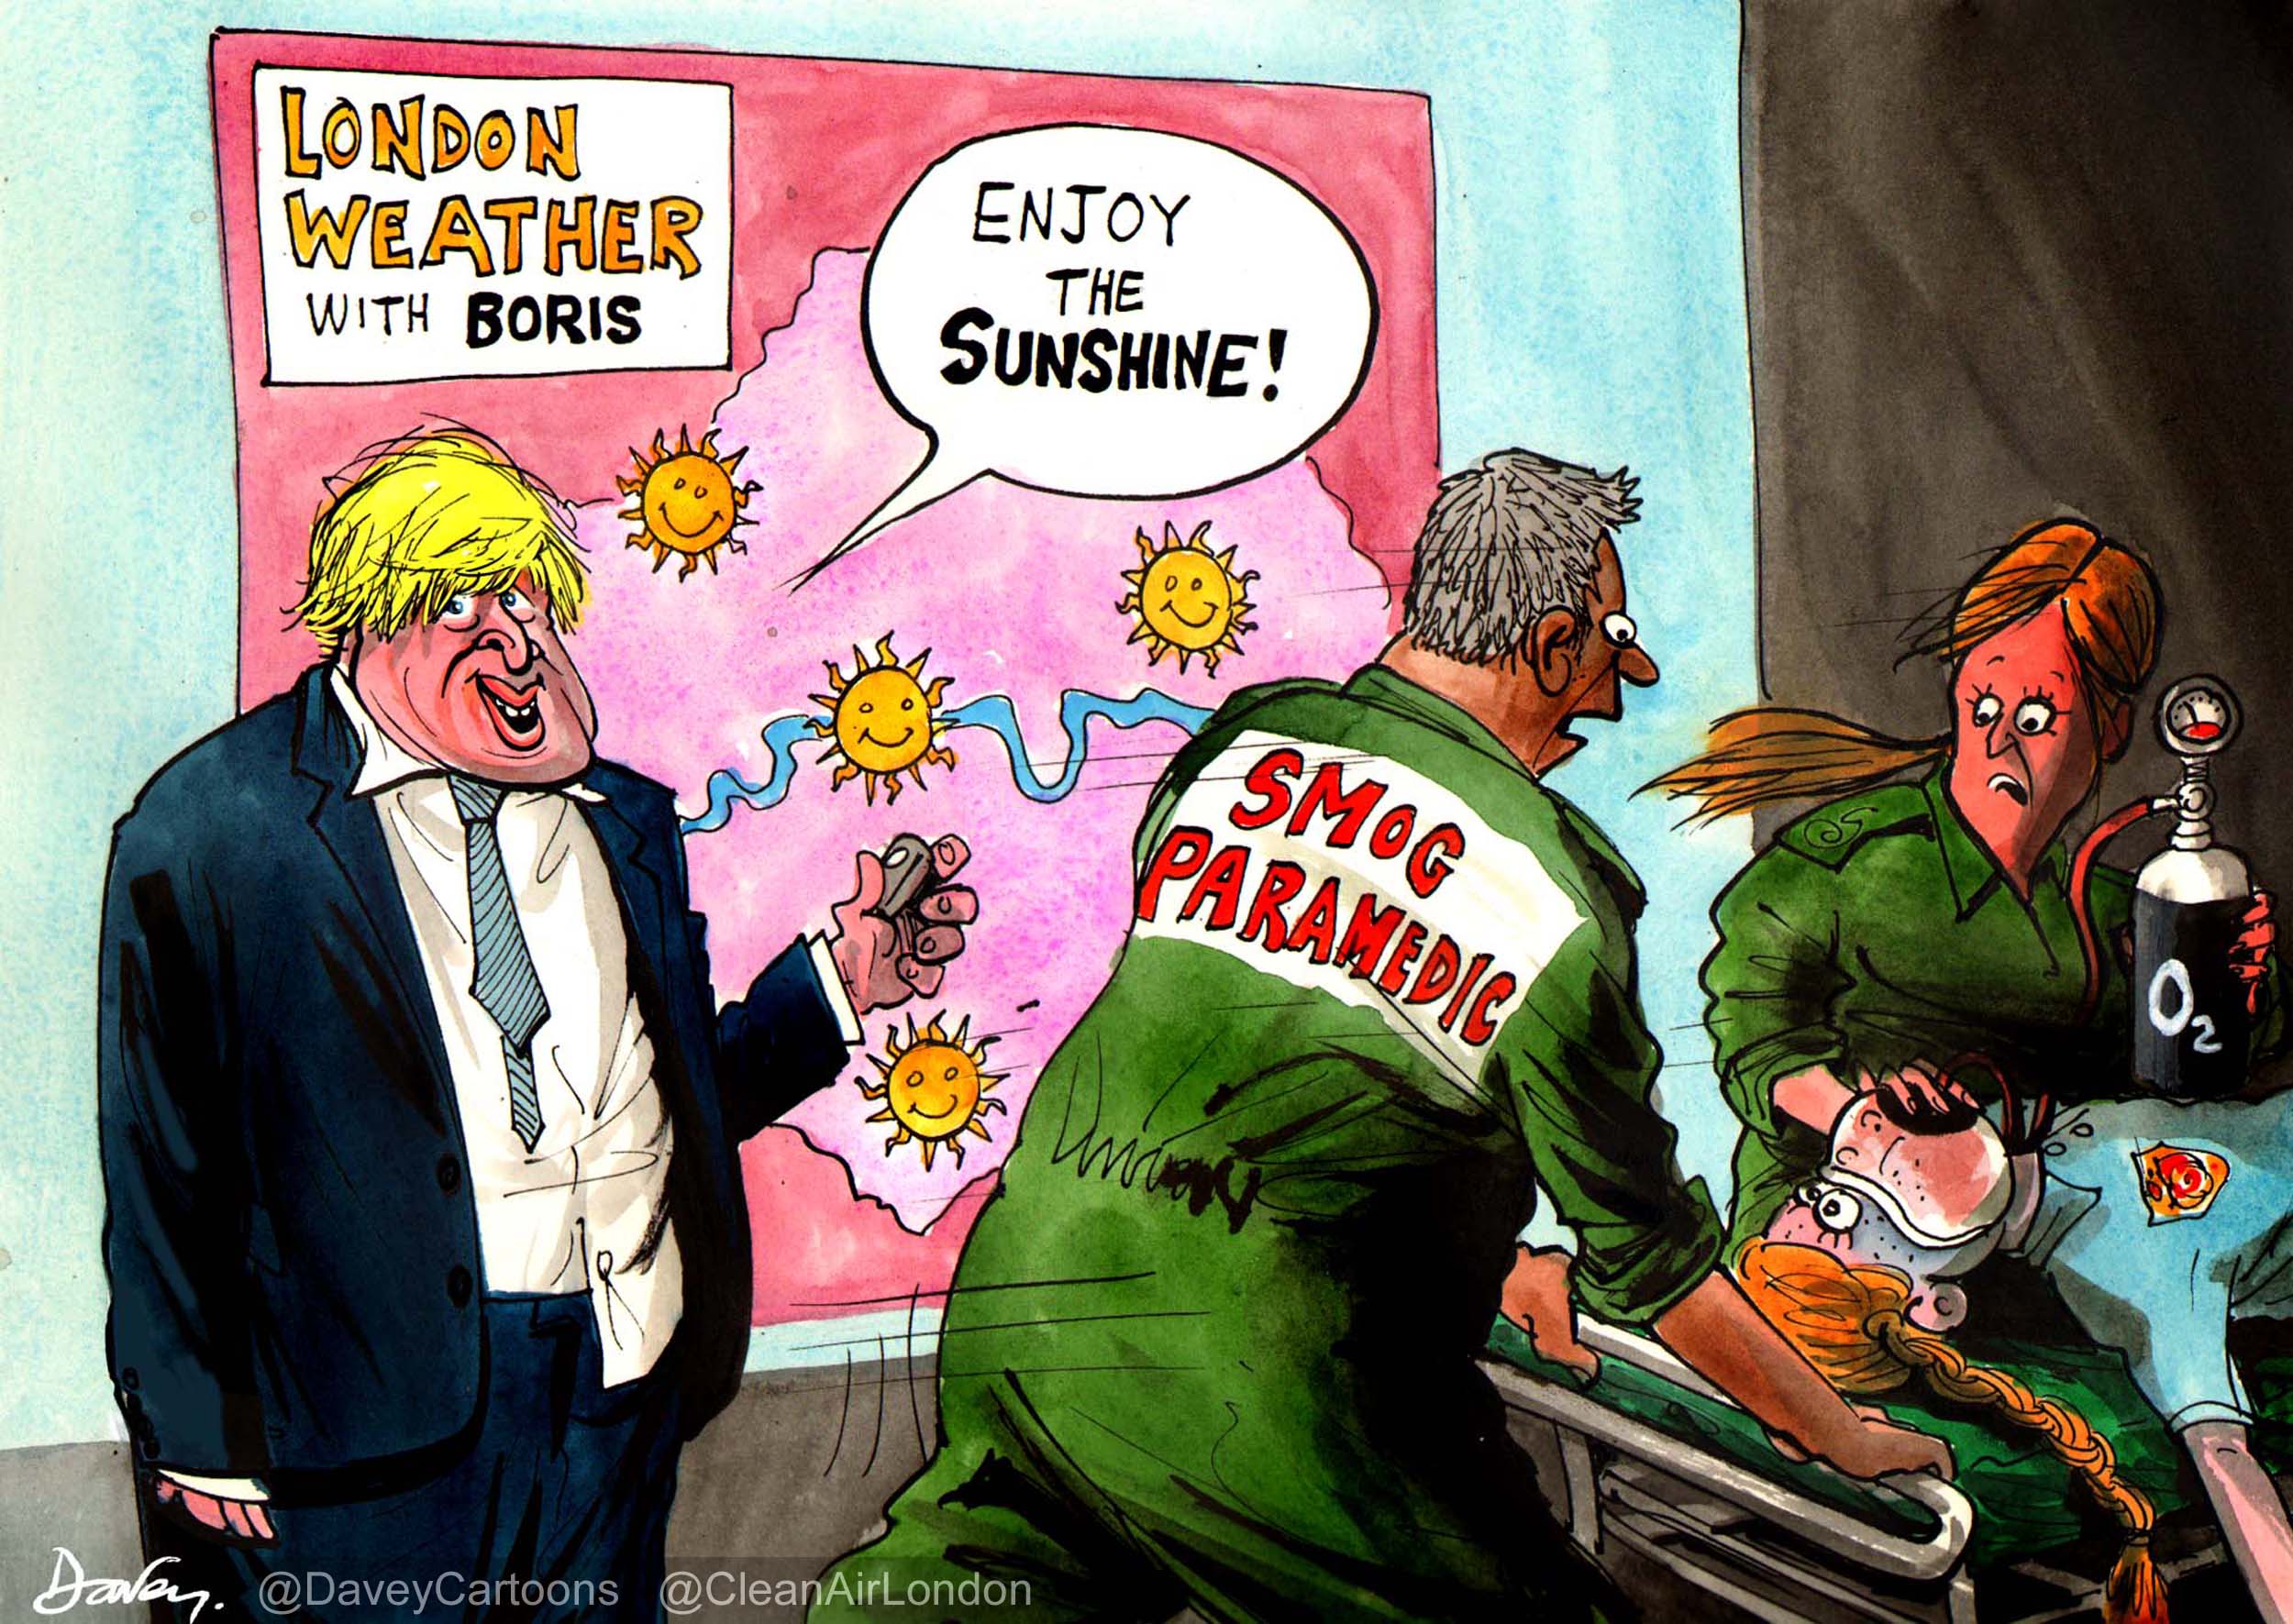
- Solutions: Boris caught reducing health protections for Londoners
Two further articles are expected shortly to address indoor air quality and the Olympics.
4. CAL has attached an Appendix with detail on ‘Solutions’ and two Case Studies on ‘Smog alerts’ and the ‘Olympic and Paralympic Route Network and related transport arrangements’.
Health impacts of poor air quality
5. Ambient or outdoor air pollution comprises particles and gases. The particles, which can comprise anything from tiny droplets to diesel soot and tyre and brake wear, are called ‘particulate matter’ and classified by their aerodynamic diameter in microns (one-millionth of a metre (mm) which is about one-hundredth of the thickness of a human hair) e.g. PM2.5 and PM10. The gases, which can coalesce and become particles, are mainly nitrogen dioxide (NO2), ozone (O3) and sulphur dioxide (SO2).
6. In the Great Smog of December 1952 there were 4,075 deaths in London due to short-term exposure to visible air pollution with more over the following months. Mayor Johnson was the first politician to use advice from the Committee on the Medical Effects of Air Pollution (COMEAP) in 2009 to publish in June 2010 estimates by ward of 4,267 deaths in London in 2008 attributable to long-term exposure to invisible PM2.5.
7. It is fair to point out there were as many early deaths in London in 2008 attributable to long-term exposure to PM2.5 as we thought occurred during the Great Smog of 1952 (due to short-term exposure to air pollution when we knew nothing of the long-term effects). On a like-for-like basis, only smoking causes more early deaths. COMEAP has speculated that air pollution may make some contribution to the earlier deaths of all those dying from cardiovascular causes e.g. heart attacks and strokes. It seems Ministers and the Mayor: do not understand the seriousness of this public health crisis; or do understand it but have chosen to downplay the issue to avoid accountability and action.
8. A more detailed explanation can be seen in the Politics Home article on Health.
Sources of air pollution
9. CAL’s analysis of the latest data from the European Environment Agency confirms that London had the highest levels of NO2, a toxic gas, of any capital city in Europe in 2010. Concentrations of PM10 are much higher in Beijing than London but levels of NO2 are comparable in the two cities.
10. Analysis by the Environmental Research Group at King’s College London has shown: little or no change in NO2 concentrations in London in the last 10 years; and small reductions in PM10 concentrations between 2008 and 2010 that have since reversed. Reductions in PM10 concentrations are likely to have been achieved as a result of the implementation of Ken Livingstone’s low emission zone (LEZ) in stages from 2008 and favourable weather conditions.
11. The Mayor’s Air Quality Strategy in 2010 estimated road transport is the main source of PM2.5 emissions in London, contributing around 80% in 2008. For emissions of NOx (i.e. not concentrations of NO2), Boris Johnson estimates road transport and domestic gas (e.g. from cooking and heating) contributed 46% and 22% respectively in 2008.
12. Transboundary air pollution can be a problem particularly when wind speeds are low. That is one reason why the PM10 daily limit value allows 35 exceedances in a year (of a daily mean of 50 micrograms per cubic metre (mg/m3)) whereas the WHO guideline is to have none. Given the prevailing winds, it is likely that London and the UK export more transboundary air pollution to continental Europe than they receive. Berlin estimates its own contribution to PM10 [emissions] has reduced by one-third since 2006. As far as CAL is aware, no comparable estimates are available for London.
13. Paragraph 1.1.4 of the Mayor of London’s Air Quality Strategy states:
“Around 40 per cent of NO2 pollution comes from emission sources outside London. Equally, data from central London indicates that about 40 per cent of PM10 originates from outside London. Sources within the UK that contribute to London’s poor air quality tend to be located in the southeast of England. It is likely that these areas are also affected by pollution from London…”
14. A more detailed explanation can be seen in the Politics Home article on Sources.
Solutions: adaptation and mitigation
15. Ahead of the Mayoral and London Assembly elections, CAL urged the candidates to make 12 commitments under five themes in their manifestos to a total of 45 measures. These included:
i. Leadership e.g. demonstrate understanding of the issues and commit to full compliance with air pollution laws before fines become payable
ii. Good governance e.g. banning the use of pollution suppressants by air quality monitors and ensuring a robust and transparent monitoring network
iii. Improve public understanding of poor air quality e.g. smog alerts and the City of London Corporation’s CityAir project which shows businesses how to help improve air quality
iv. Reduce traffic emissions e.g. an inner low emission zone encouraging a shift away from diesel vehicles in the most polluted places (i.e. towards petrol, hybrid, electric and/or biogas), freight consolidation and fitting abatement equipment to the most-polluted vehicles. In general, we need fewer and cleaner vehicles in the most polluted places
v. Cleaner public transport fleet e.g. reduce high concentrations of particles in the London Underground, fit abatement equipment to buses and replace rapidly the current taxi fleet
vi. Reduce emissions from non-road mobile machinery e.g. diesel particulate filters can reduce particle emissions from construction equipment by some 75%
vii. Support active travel e.g. encouraging walking and cycling. Introduce 20 mph zones which Berlin has shown can reduce NO2 concentrations by 10-15% (when combined with traffic smoothing and strict enforcement)
viii. Plan for good air quality e.g. energy efficient buildings and travel plans
ix. Reduce building emissions e.g. use boilers with low emissions of oxides of nitrogen
x. Improve indoor air quality e.g. comply with European and British guideline BS EN 13779
xi. Focus on children, the elderly, the poor and ethnic minorities e.g. schools
xii. Ensure a low emission Olympics with a legacy e.g. one or more inner LEZs based around the central London zone and other hotspots
16. See a more detailed analysis in the Appendix and the Politics Home article on Solutions.
Air quality laws
17. Air quality laws are breached every day by a factor or two or more along London’s busiest roads (and elsewhere). No other public health or environmental standard is breached on such a large scale with such serious consequences for public health.
18. CAL has therefore lodged a formal complaint with the European Commission about the UK’s failure to comply with air quality laws. ‘Part one’ of the Complaint is that: the UK obtained unlawfully a time extension to comply with the daily limit value for PM10 in London; and, without prejudice to that part of the Complaint, even if a time extension is sustained for the PM10 daily limit value, it was breached in Neasden Lane, London (again) in 2011. ‘Part two’ of the Complaint is that: the UK breached the annual mean and hourly limit values for NO2 in London and 16 other zones in 2010 (and 2011); and has not applied for a time extension for those zones (i.e. it submitted: plans for 23 zones in September 2011 under Article 22 of Directive 2008/50/EC on ambient air quality and cleaner air for Europe; and plans for London and 16 other zones under Article 23). A response to CAL’s compliant is expected shortly.
19. The excellent London Air Quality Network reported Neasden Lane in Brent as having reached 36 Bad Air Days on 10 April 2012. Brent Council has said the site meets the requirements of Directive 2008/50/EC but Defra says it does not. See:
http://www.londonair.org.uk/london/asp/news.asp?NewsId=PM10Brent&StartIndex=11
By 6 June 2012, the monitoring station in Neasden Lane was reporting 42 Bad Air Days. See:
20. In response to a letter from CAL seeking details of equalities assessments undertaken by Defra in relation to NO2 plans and programmes submitted to the European Commission, Defra told CAL in a letter dated 31 August 2011:
“It is not Government policy to carry out ‘integrated’ impact assessments for plans such as air quality plans that collate existing policies and plans for which impact assessments (IAs) have already been carried out. Government is required to conduct IAs for potential new policies and, as you know, an options stage IA for a Low Emission Zone (LEZ) framework measure was referenced in the consultation. Developing an IA is a continuous process and the IA for the LEZ framework, or any other new measure, will consider the need for assessments on race equality and human rights impacts as part of this process.”
In summary, together with other correspondence, CAL has discovered that Defra has: produced no new plans to comply with NO2 limit values; undertaken no equalities assessment; and holds no information relating to inequalities and NO2.
21. A report for Defra titled ‘Air Quality and Social Deprivation in the UK: an environmental inequalities analysis’ (Interim Report 2 to Defra under Task 3 of Contract RMP/2035) dated June 2005 showed that 18.8% of the most deprived decile of the population experienced the highest 10% of NO2 concentrations compared to 2.8% of the least deprived decile (Table 5.1 on page 20).
22. The Court of Appeal ruled on 30 May 2012 that the UK’s breaches of air quality laws are a matter for the European Commission. ClientEarth’s case against the Government in the High Court in December 2011 forced Defra to admit that it has breached NO2 limit values.
23. Defra’s response to the Red Tape Challenge dated 19 March 2012 stated on page 7 “Working in partnership with other Member States, we will also use the European Commission review of air quality legislation, expected in 2013, to seek:
- Amendments to the Air Quality Directive which reduce the infraction risk faced by most Member States, especially in relation to nitrogen dioxide provisions.”
http://www.defra.gov.uk/publications/files/pb13728-red-tape-environment.pdf
These legal standards which align closely with World Health Organisation guidelines have been in legislation since 1999 to be complied with by January 2010. The Coalition Agreement stated “We will work towards full compliance with European Air Quality standards” (page 17).
24. Defra blames the failure of Euro engine emission standards for diesel vehicles for the UK’s non-compliance with air quality laws. However, the current and previous Government encouraged the increase in market share of diesel cars and vans from around 10% to over 50% (including after problems caused by diesel vehicles became well known).
25. CAL has urged the European Commission to launch infraction action against the UK before the Olympics for breaching the PM10 daily limit value and the NO2 annual mean and hourly limit values in London including along the ORN in earlier years.
London and the UK should be leading the world in tackling air pollution as it did after the Great Smog of 1952.
APPENDIX ONE: Successes and challenges in London and Government support needed
26. CAL’s model for reducing air pollution is a ‘seesaw’. On left of the fulcrum we need to: increase (i.e. increase upward pressure) public understanding of the dangers of air pollution with advice for people on protecting themselves and reducing pollution for themselves and others; and reduce measures or action (i.e. reduce downward pressure) that inhibit such understanding e.g. the use of pollution suppressants in front of the air quality monitors most-used to warn the public of smog episodes and the failure to issue smog alerts. On the right of the fulcrum we need to: reduce air pollution at its source (i.e. increase downward pressure) e.g. introduce a network of inner low emission zones in cities; and reduce negative policies (i.e. reduce upward pressure) e.g. the use of biomass burning in cities.
27. Air pollution needs to be reduced at its source. ‘Offsetting’ is not a sustainable solution as it fails to tackle the underlying problem and sooner or later brings problems of its own (e.g. using pollution suppressants or planting trees). In assessing solutions, CAL advocates ‘The London Principle’ which is to accept a 1% increase in CO2 to achieve a 10% reduction in harmful emissions (and vice versa) provided legal limits are met. CAL also advocates a simultaneous focus on short-term abatement solutions and long-term ultra or zero low emission solutions rather than short and medium term ‘hybrid’ solutions which fail to address short-term health and legal challenges and undermine and delay the long-term solutions e.g. London needs to retrofit existing buses not buy hybrids (unless retrofit is impossible).
28. Boris Johnson included no new policies to tackle air pollution in his Mayoral manifesto. Worse, he showed a lack of understanding of the issue by portraying the 100% discount to the Congestion Charge for Euro 5 (diesel) vehicles with CO2 emissions of less than 99g/km as an air quality measure when it is not i.e. CO2 in ambient air is not harmful to health. With no new policies, Boris Johnson was given a negative score in a ranking of the Mayoral candidates because he was caught actively suppressing public awareness of air pollution and campaigning with the Government to weaken UK and international air quality laws.
29. Successes in London:
i. The City of London Corporation’s CityAir scheme which needs funding and rollout
ii. The Mayor’s London Plan which includes a number of protections sought by CAL
iii. Health and Wellbeing Boards which will have duties in relation to air pollution from 2013
iv. The Mayor made three ‘Love London, Go Dutch’ cycling promises in the recent election
30. Problems in London:
i. Lack of leadership on the air pollution issue. No new policies on air pollution from Mayor Johnson for his second term. ‘Dead-bat’ and ‘defusing’ the issue when it arises
ii. Delaying Phase 3 of the LEZ until January 2012. The London LEZ is two steps and two and a half years behind the central Berlin equivalent
iii. The Pollution Suppressor targeting legal compliance rather than the most vulnerable
iv. Painfully slow progress on retrofitting London’s bus fleet
v. Failure to scrap the oldest licenced taxis reportedly because of ‘State Aid’ fears
vi. The Association of London Environmental Health Managers (ALEHM) has highlighted gaps in London’s air quality monitoring network, lack of funding and a fragmentation of unified reporting i.e. on the London Air Quality Network (LAQN)
vii. The use of biomass boilers, local power generation (CHP) and domestic solid fuel burning. This is a policy ‘time bomb’ not least because of its consequences for health
viii. Working against public understanding of the issue e.g. using ‘dust’ to describe dangerous airborne particles; a refusal to issue smog alerts even which pollution levels could cause problems for healthy people (who are unlikely to be aware of the issue); and messaging that misleads the public by highlighting reductions in pollution but not the sharp increase in understood health impacts e.g. research showing living or going to school within 150 metres of roads carrying over 10,000 vehicles per day could be responsible for 15-30% of all new cases of asthma in children and chronic obstructive pulmonary disease in adults 65 years of age and older.
31. Needed from Government:
i. Leadership. A campaign to build public understanding on the scale of those for smoking, alcoholism and illnesses e.g. dementia, lung cancer etc
ii. Actions requested by the Environmental Audit Committee which were rejected by the Government e.g. a new air quality strategy lead by the Cabinet Office
iii. A network of low emission zones. Germany has 56 LEZs in force or planned. The Berlin LEZ has been the most effective single mitigation measure having reduced NO2, PM2.5 and PM10 concentrations by 5-10%, black carbon by around 50% and Bad Air Days by about 10
iv. Joined-up policies on air pollution that take full account of air quality impacts e.g. the Energy Bill and policies that promote CHP, biomass and diesel use
http://www.official-documents.gov.uk/document/cm83/8362/8362.pdf
v. Mayor’s list of 14 measures in Policy 13 of the Mayor’s Air Quality Strategy. Only £10m has been forthcoming. See MQT Question No.: 1293 in May 2012:
“The Department for Transport has given London £5m to establish the Clean Air Fund of innovative measures, £5m towards the cost of retrofitting up to 1,000 buses with selective catalytic reduction equipment and, through the Green Bus Fund, has given over £18million to fund hybrid buses over the past four years.”
http://mqt.london.gov.uk/mqt/public/question.do?id=40892
vi. Policies to reduce sharply diesel emissions which are 21 times higher for PM10 than petrol for saloon cars e.g. point of sale information. The International Agency for Research on Cancer, part of the WHO, classifies diesel engine exhaust as “probably carcinogenic to humans”. Vehicle manufacturers should be required to offer diesel particulate filter retrofit for their existing diesel vehicle stock. There should be mandatory regular testing of off-road vehicles.
http://www.theyworkforyou.com/wrans/?id=2011-10-03a.68700.h
vii. Stop the use of standby (diesel) generators (in cities) to supply electricity to the grid
viii. Ask COMEAP to update its 2002 advice on air pollution in the London Underground
ix. Smog alerts when NO2, O3, PM2.5, PM10 and/or SO2 are expected to be MODERATE for two or more consecutive days or HIGH or VERY HIGH for one or more. Such a policy costs nothing and could save lives and avoid hospitalisations and suffering
x. Ensure Health and Wellbeing Boards understand that air pollution is likely to be the second biggest public health risk they are responsible for managing
xi. Ensure before the Olympics that COMEAP’s Daily Air Quality Index is used consistently by all alert services per the LAQN e.g. by airTEXT, BBC, Met Office etc
http://www.londonair.org.uk/london/asp/news.asp?NewsId=DAQIwebsitediff&StartIndex=11
xii. Who has overall accountability for the success of the Olympic transport plans? Ensure full compliance with air pollution laws including if the M4 bus lane is to be removed
CASE STUDY ONE: Smog alerts: the ‘wrong sort of air pollution and/or monitoring network’
32. In CAL’s view, the issuing of smog alerts when air pollution of any sort is likely to be MODERATE on two or more days or HIGH or VERY HIGH on one or more days is the most obvious first step to building public understanding of the dangers of air pollution. Such alerts can include advice for people on protecting themselves and reducing air pollution for themselves and others.
33. There have been seven smog episodes in London already this year. On several occasions air pollution has reached 10/10 on the Daily Air Quality Index (i.e. the worst). On 15 March, the highest concentrations of fine particles (PM2.5) were recorded in London since a new monitoring system was introduced. The London Air Quality Network reported the first HIGH (i.e. 7/10) ozone in 2012 in Sevenoaks – Greatness Park between 22 and 29 May 2012. See:
http://www.londonair.org.uk/london/asp/publicepisodes.asp?region=0
34. R. Atkinson et al titled ‘Links between urban ambient particulate matter and health – time series analysis of particles metrics’ found an association between cardiovascular mortality and the previous day particle concentrations. See:
http://www.ncbi.nlm.nih.gov/pubmed/20502338
35. The previous Government estimated 46 to 212 early deaths in London attributable to ozone and 85 attributable to short-term exposure to PM10 in the “Summer Smog” of 2003. See:
http://uk-air.defra.gov.uk/reports/cat09/0401130931_heatwave2003.pdf
36. On 27 February 2012, the Environmental Audit Committee published the Government’s response to its further inquiry into air quality which stated “The Government strongly supports and welcomes campaigns to improve understanding of the public health impact of air pollution at local level and agrees that better public awareness is vital.” (paragraph 57).
http://www.publications.parliament.uk/pa/cm201012/cmselect/cmenvaud/1820/182002.htm
37. On 21 April 2011, Defra issued a ‘press release’ titled ‘High air pollution episode warning: First summer smog of 2011’. It resulted in national media coverage including on the front page of leading newspapers. See:
http://www.defra.gov.uk/news/2011/04/21/summer-smog/
38. On 3 April 2012, Defra issued an ‘Information bulletin’ titled ‘Air pollution’ that did not mention ozone (and unusually cannot be printed). It seemed to be issued in response to ridicule from the Telegraph newspaper the previous weekend. The only coverage of it, as far as CAL is aware, was in the Telegraph the following weekend. See:
http://www.defra.gov.uk/news/2012/04/03/air-pollution/
39. On 16 April 2012, an Environment Minister told Ben Bradshaw MP “DEFRA has also undertaken to issue a press release when the first ozone episode occurs each year.” See:
http://www.theyworkforyou.com/wrans/?id=2012-04-16b.100484.h
40. On 24 May 2012 a Defra official was quoted in AirQualityNews as saying:
Speaking to AirQualityNews, a spokeswoman for Defra said that as yet only moderate levels of ozone had been recorded across the capital by the government and any high ozone readings would be publicised immediately.
She said: “If there is an episode of smog we would issue alerts in the form of an information bulletin, but we haven’t reached high ozone levels yet. Defra would also issue a bulletin at the beginning of the smog season, although there is no legal requirement for us to do so. We have monitoring stations across the country which are updated throughout the day.”
41. CAL considers it very odd that Defra says ‘better public awareness is vital’ but then chooses not to issue press releases during smog episodes when health advice may avoid premature cardiovascular mortality. It seems it’s the ‘wrong sort of air pollution’ or the ‘wrong sort of monitoring network’ for issuing press releases. To compound the problem, the Mayor of London says it is the Government’s responsibility to issue smog alerts, not him.
42. Policy 12 of the Mayor’s Air Quality Strategy titled ‘Raising public awareness of air quality issues’ states “The Mayor will encourage individuals to take action to improve air quality and will encourage the provision of targeted information about air quality to people most at risk from the health effects of air pollution”.
43. A spokesperson for the Department for Environment, Food and Rural Affairs (Defra) was quoted on YourLocalGuardian.co.uk on 4 June 2012:
“We want to keep improving air quality and reduce the impact it can have on human health and the environment.
“Our air quality has improved significantly in recent decades and is now generally very good, and almost all of the UK meets EU air quality limits for all pollutants.”
“There are some limited areas where air pollution remains an issue but that’s being dealt with by the air quality plans, which set out all the important work being done at national, regional and local levels to make sure we meet EU limits as soon as we can.”
http://www.yourlocalguardian.co.uk/news/9740919.Not_enough_smog_alerts_for_polluted_Putney/
44. In CAL’s opinion, the Government is consistently failing to warn the public or ‘covering-up’ the biggest public health risk after smoking.
CASE STUDY TWO: Olympic and Paralympic Route Network and associated transport arrangements (ORN/PRN)
45. We were promised the ‘greenest Games ever’.
46. All this matters for London and the Olympics since limit values must not be exceeded once attained and air pollution may not be worsened where limit values are already breached. CAL has sought assurances about the impact of the Olympic Route Network after the Strategic Environmental Assessment for the Olympic Transport Plan admitted in February 2011 “However, the number of daily mean exceedances at some roadside sites is anticipated to be more than the allowable number of exceedances.”
47. When asked at the Transport Committee “Will the transport arrangements lead to breaches of air quality law?”, the Secretary of State for Transport said “The short answer is no”. When pressed, she went on to say that “The overall assessment was that those differences were not material enough to change the decision” and hopefully they would be “few and far between”.
48. CAL’s solicitors have written to Transport for London (TfL) saying we remain concerned that “the approach taken by TfL to assessing and mitigating the air quality impacts of the ORN/PRN will fail to protect the health of Londoners and is unlawful and fails to meet the obligations of the Air Quality Standards Regulations 2010”.
49. A TfL report in March 2012 said that pollution suppressants would be used to mitigate increases in PM10 caused by the ORN/PRN and related traffic arrangements. See:
http://www.tfl.gov.uk/assets/downloads/corporate/tfl-orn-air-quality-report-march-2012.pdf
50. On 6 June 2012, the London Air Quality Network was showing Upper Thames Street, at the heart of the Olympic Route Network, on 35 Bad Air Days i.e. on the cusp of exceeding the 36 allowed for the whole year. As in Neasden Lane, Brent, Defra may seek to dispute the validity of the site:
51. In previous Games, odd and even number plate bans or the ‘Big Scare’ tactic have been used to achieve the 30% reductions in background traffic needed to ensure the smooth operation of the ORN/PRN. Mayor Johnson has opted for hundreds and perhaps thousands of local traffic restrictions and uncertainty instead of adopting the Berlin-type LEZ that CAL has advocated for the past four years to give certainty and ensure a legacy from the Games. The latest advice for drivers is to avoid central London, the ORN and Olympic venues unless travel is essential. TfL plans to use the Pollution Suppressor to mitigate PM10 impacts. The final result for air pollution is likely to depend on the weather.
52. Top UK lung scientists are warning that a “Summer Smog”, like August 2003 or July 2006, could affect Olympic athletes this summer. See The Independent on 16 January 2012:
53. These scientists were reported as saying that if we have still hot days, long distance athletes, like marathon runners and cyclists who breathe very hard, could feel a tightness in their chest or experience ‘coughs, breathlessness or other problems’. Those with asthma may need medication. Athletic performance could be affected.
54. This section highlights the legal requirements to ensure: the PM10 daily and annual mean limit values are not exceeded in London (or elsewhere) in 2012 (e.g. no more than 35 ‘Bad Air Days’ when 35 have been reported already along the ORN at Upper Thames Street); the NO2 hourly and annual mean limit values are not to be exceeded where they have previously been attained (e.g. in nearby roads); and NO2 levels are not worsened by the Olympic Transport Plan and/or ORN where levels of air pollution are currently breaching legal limits (e.g. along much of the ORN in central London).
55. Most important to understand is that air pollution limits are absolute and apply everywhere (more or less) i.e. air pollution cannot be ignored on the grounds of materiality or its local or temporary nature.