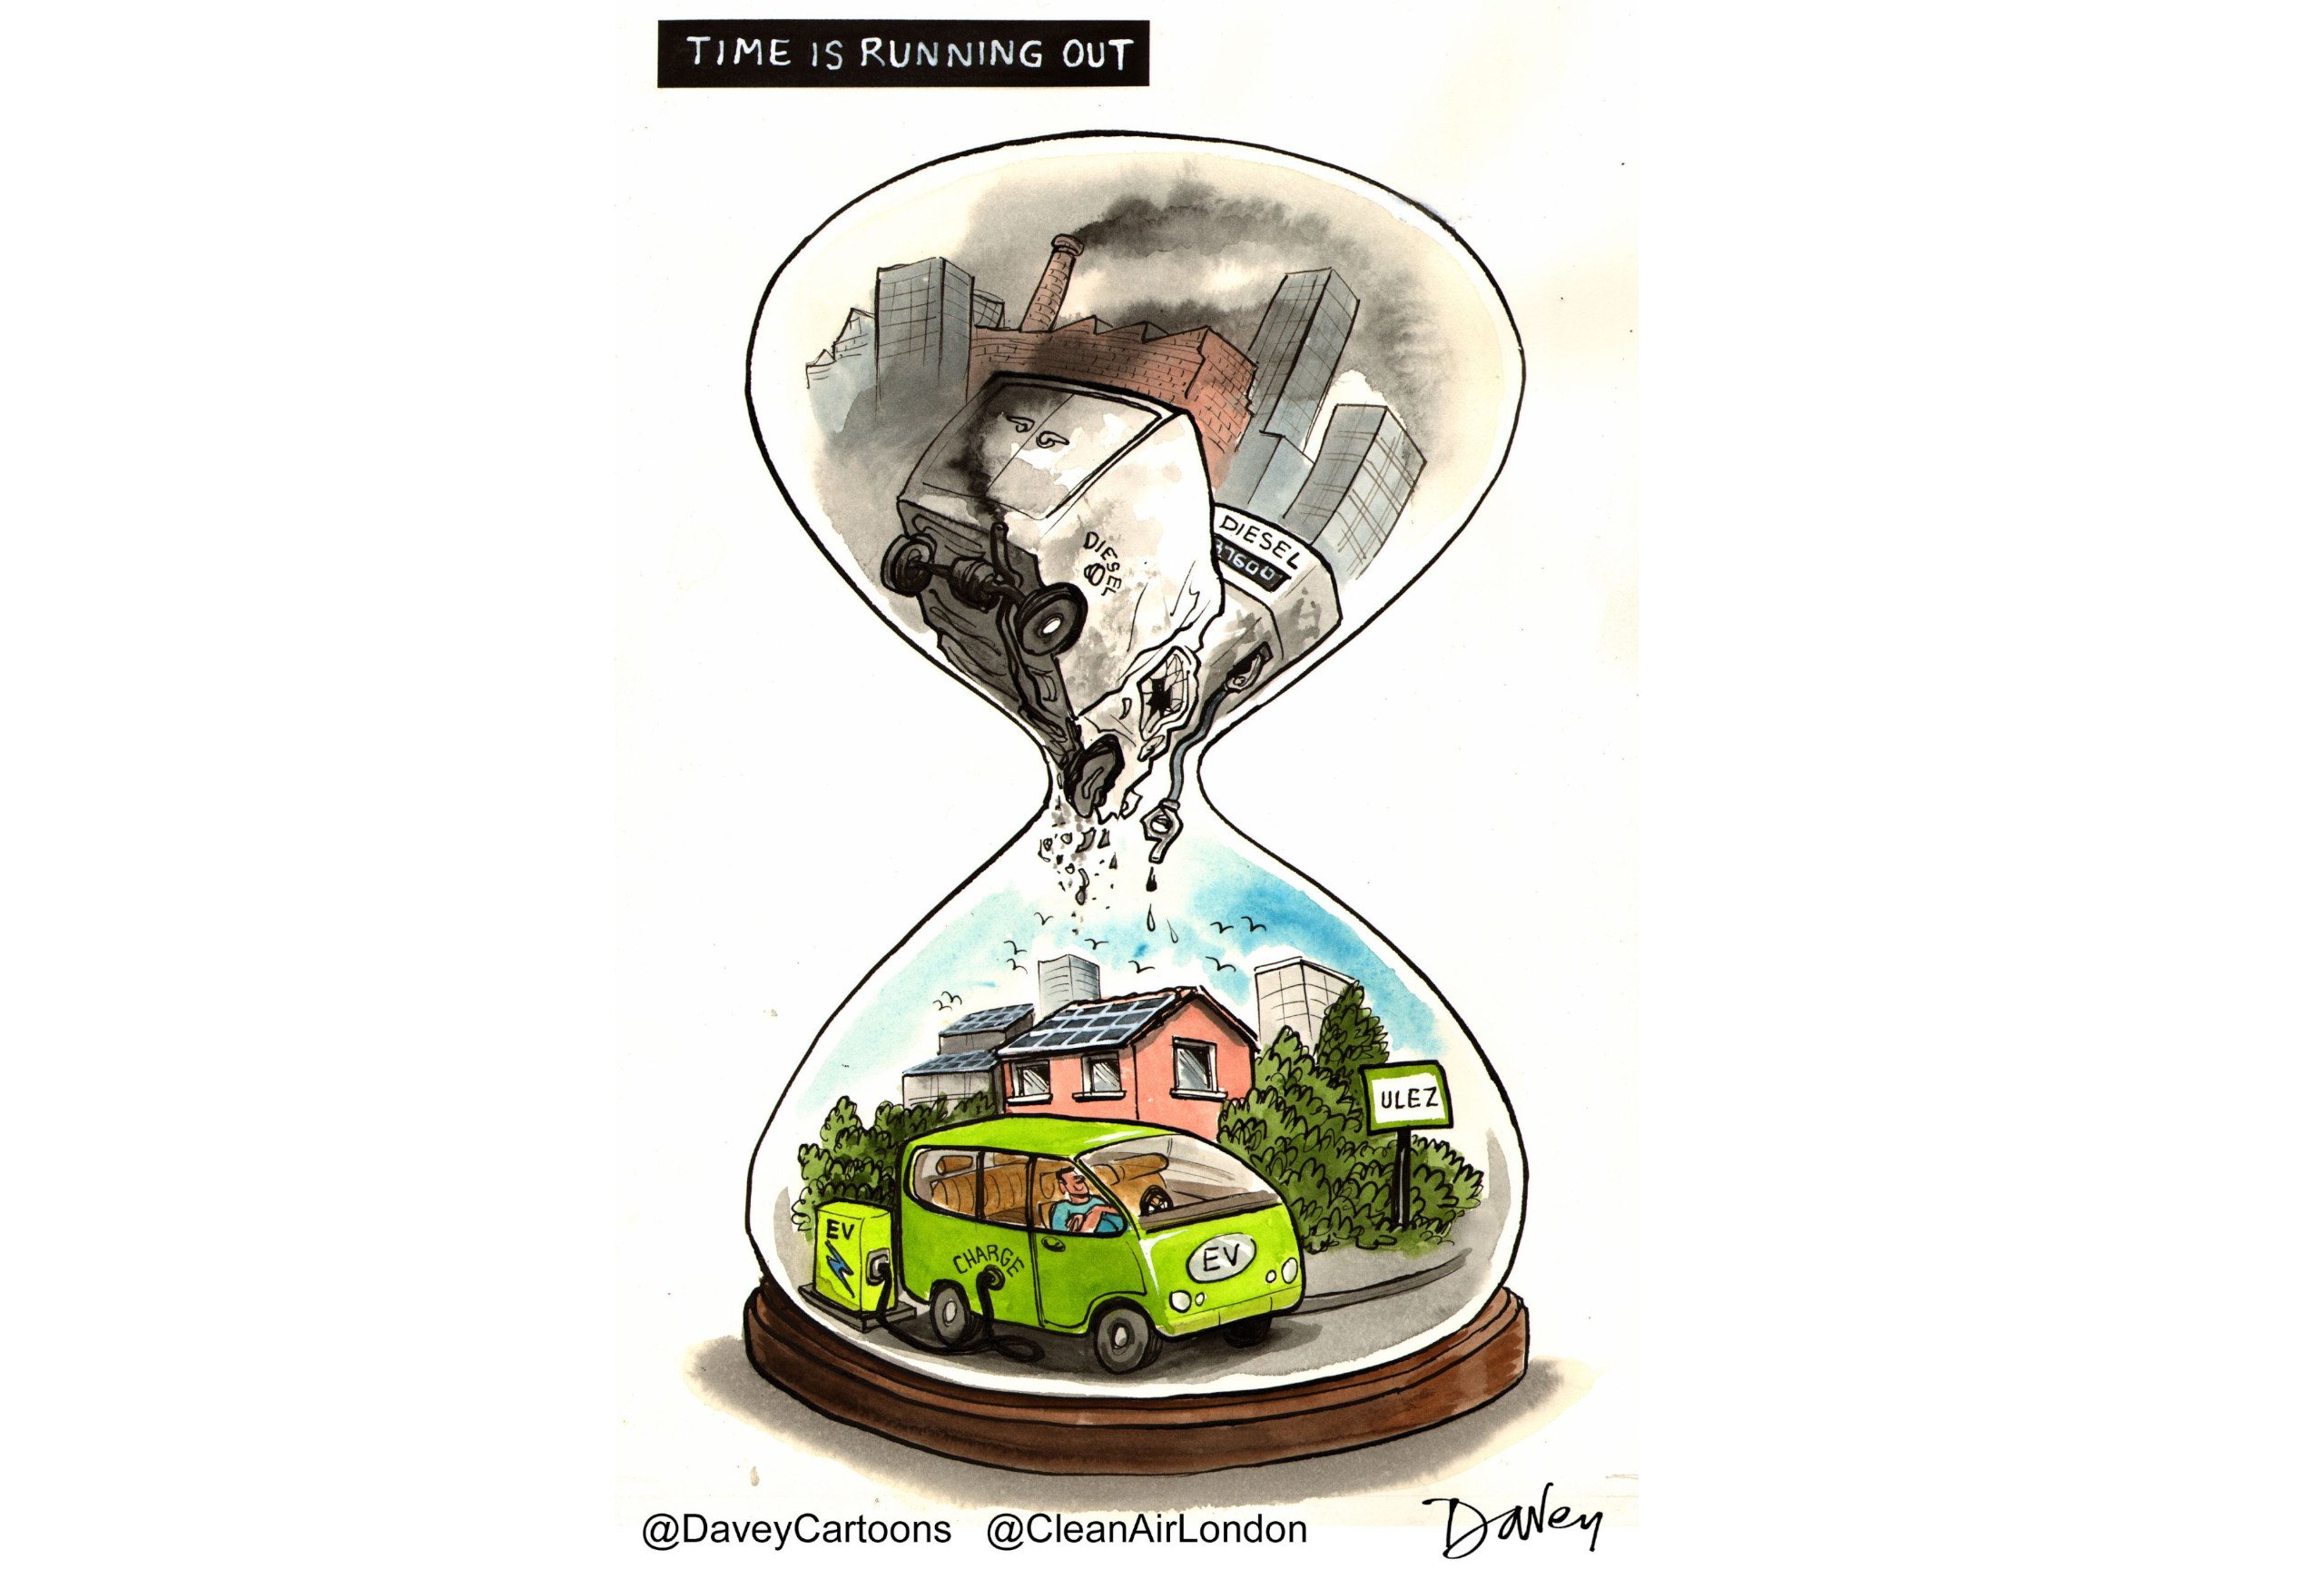
34 of 43 UK zones breached the nitrogen dioxide (NO2) annual limit value in 2012
Cardiff has joined Leicester, North Wales, Nottingham and Portsmouth in breaching the terms of their time extensions. Bournemouth and Coventry failed to meet the pre-condition for theirs
Levels of NO2 at long-running urban traffic locations have not improved since monitoring began 15 years ago
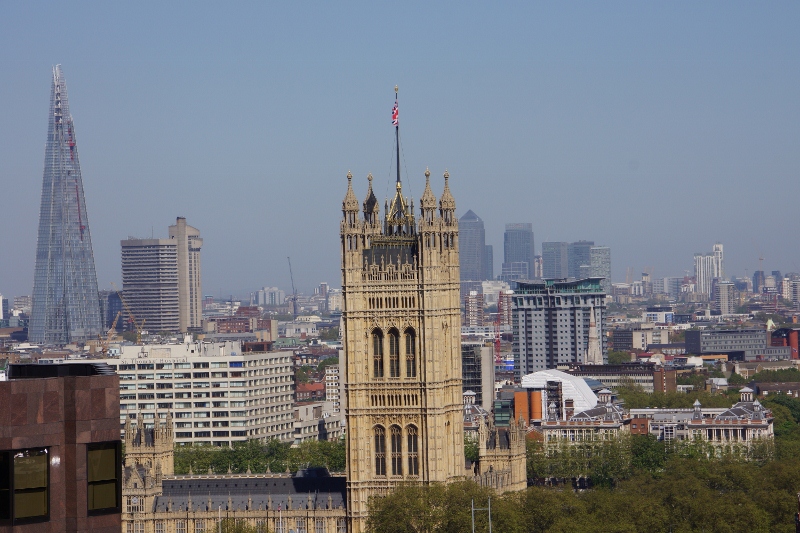
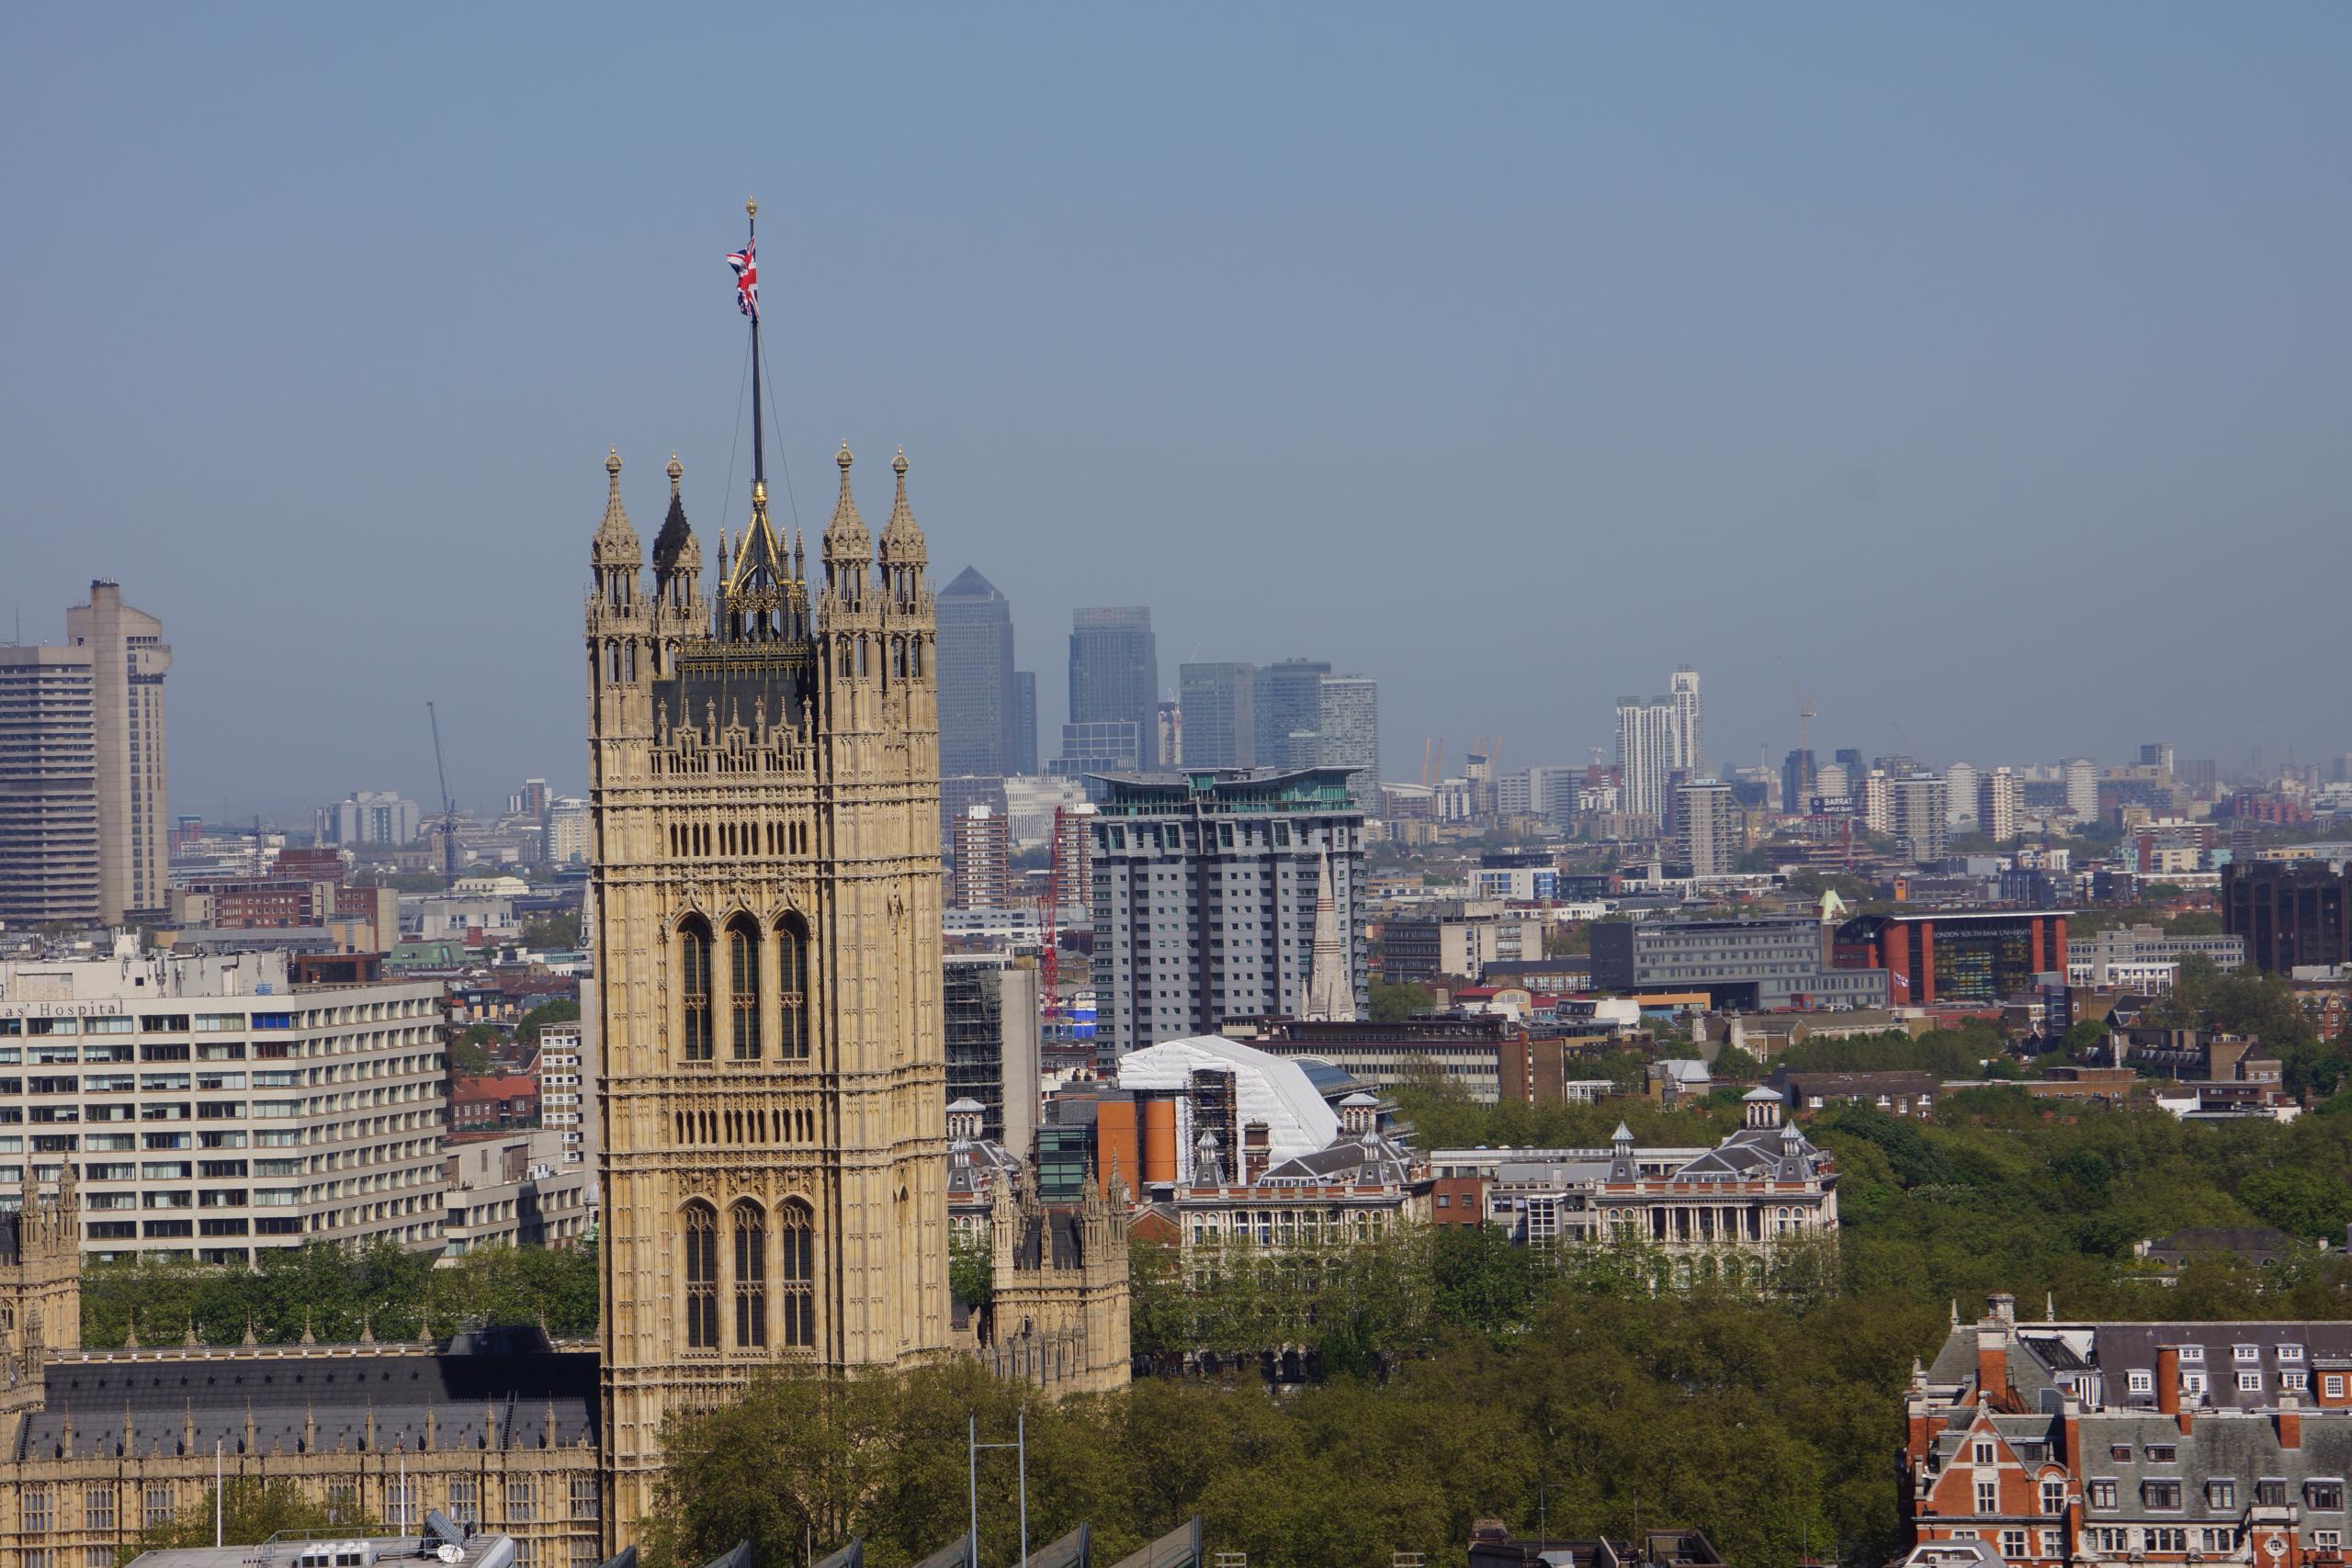
Government is covering-up breaches of the PM10 daily limit value in London in 2012 by dismissing some monitors and blaming ‘sea salt’ for smog episodes when it admits the worst particle smog episodes occurred when wind speeds were low and/or from the north of mainland Europe. It is misleading the European Commission yet again
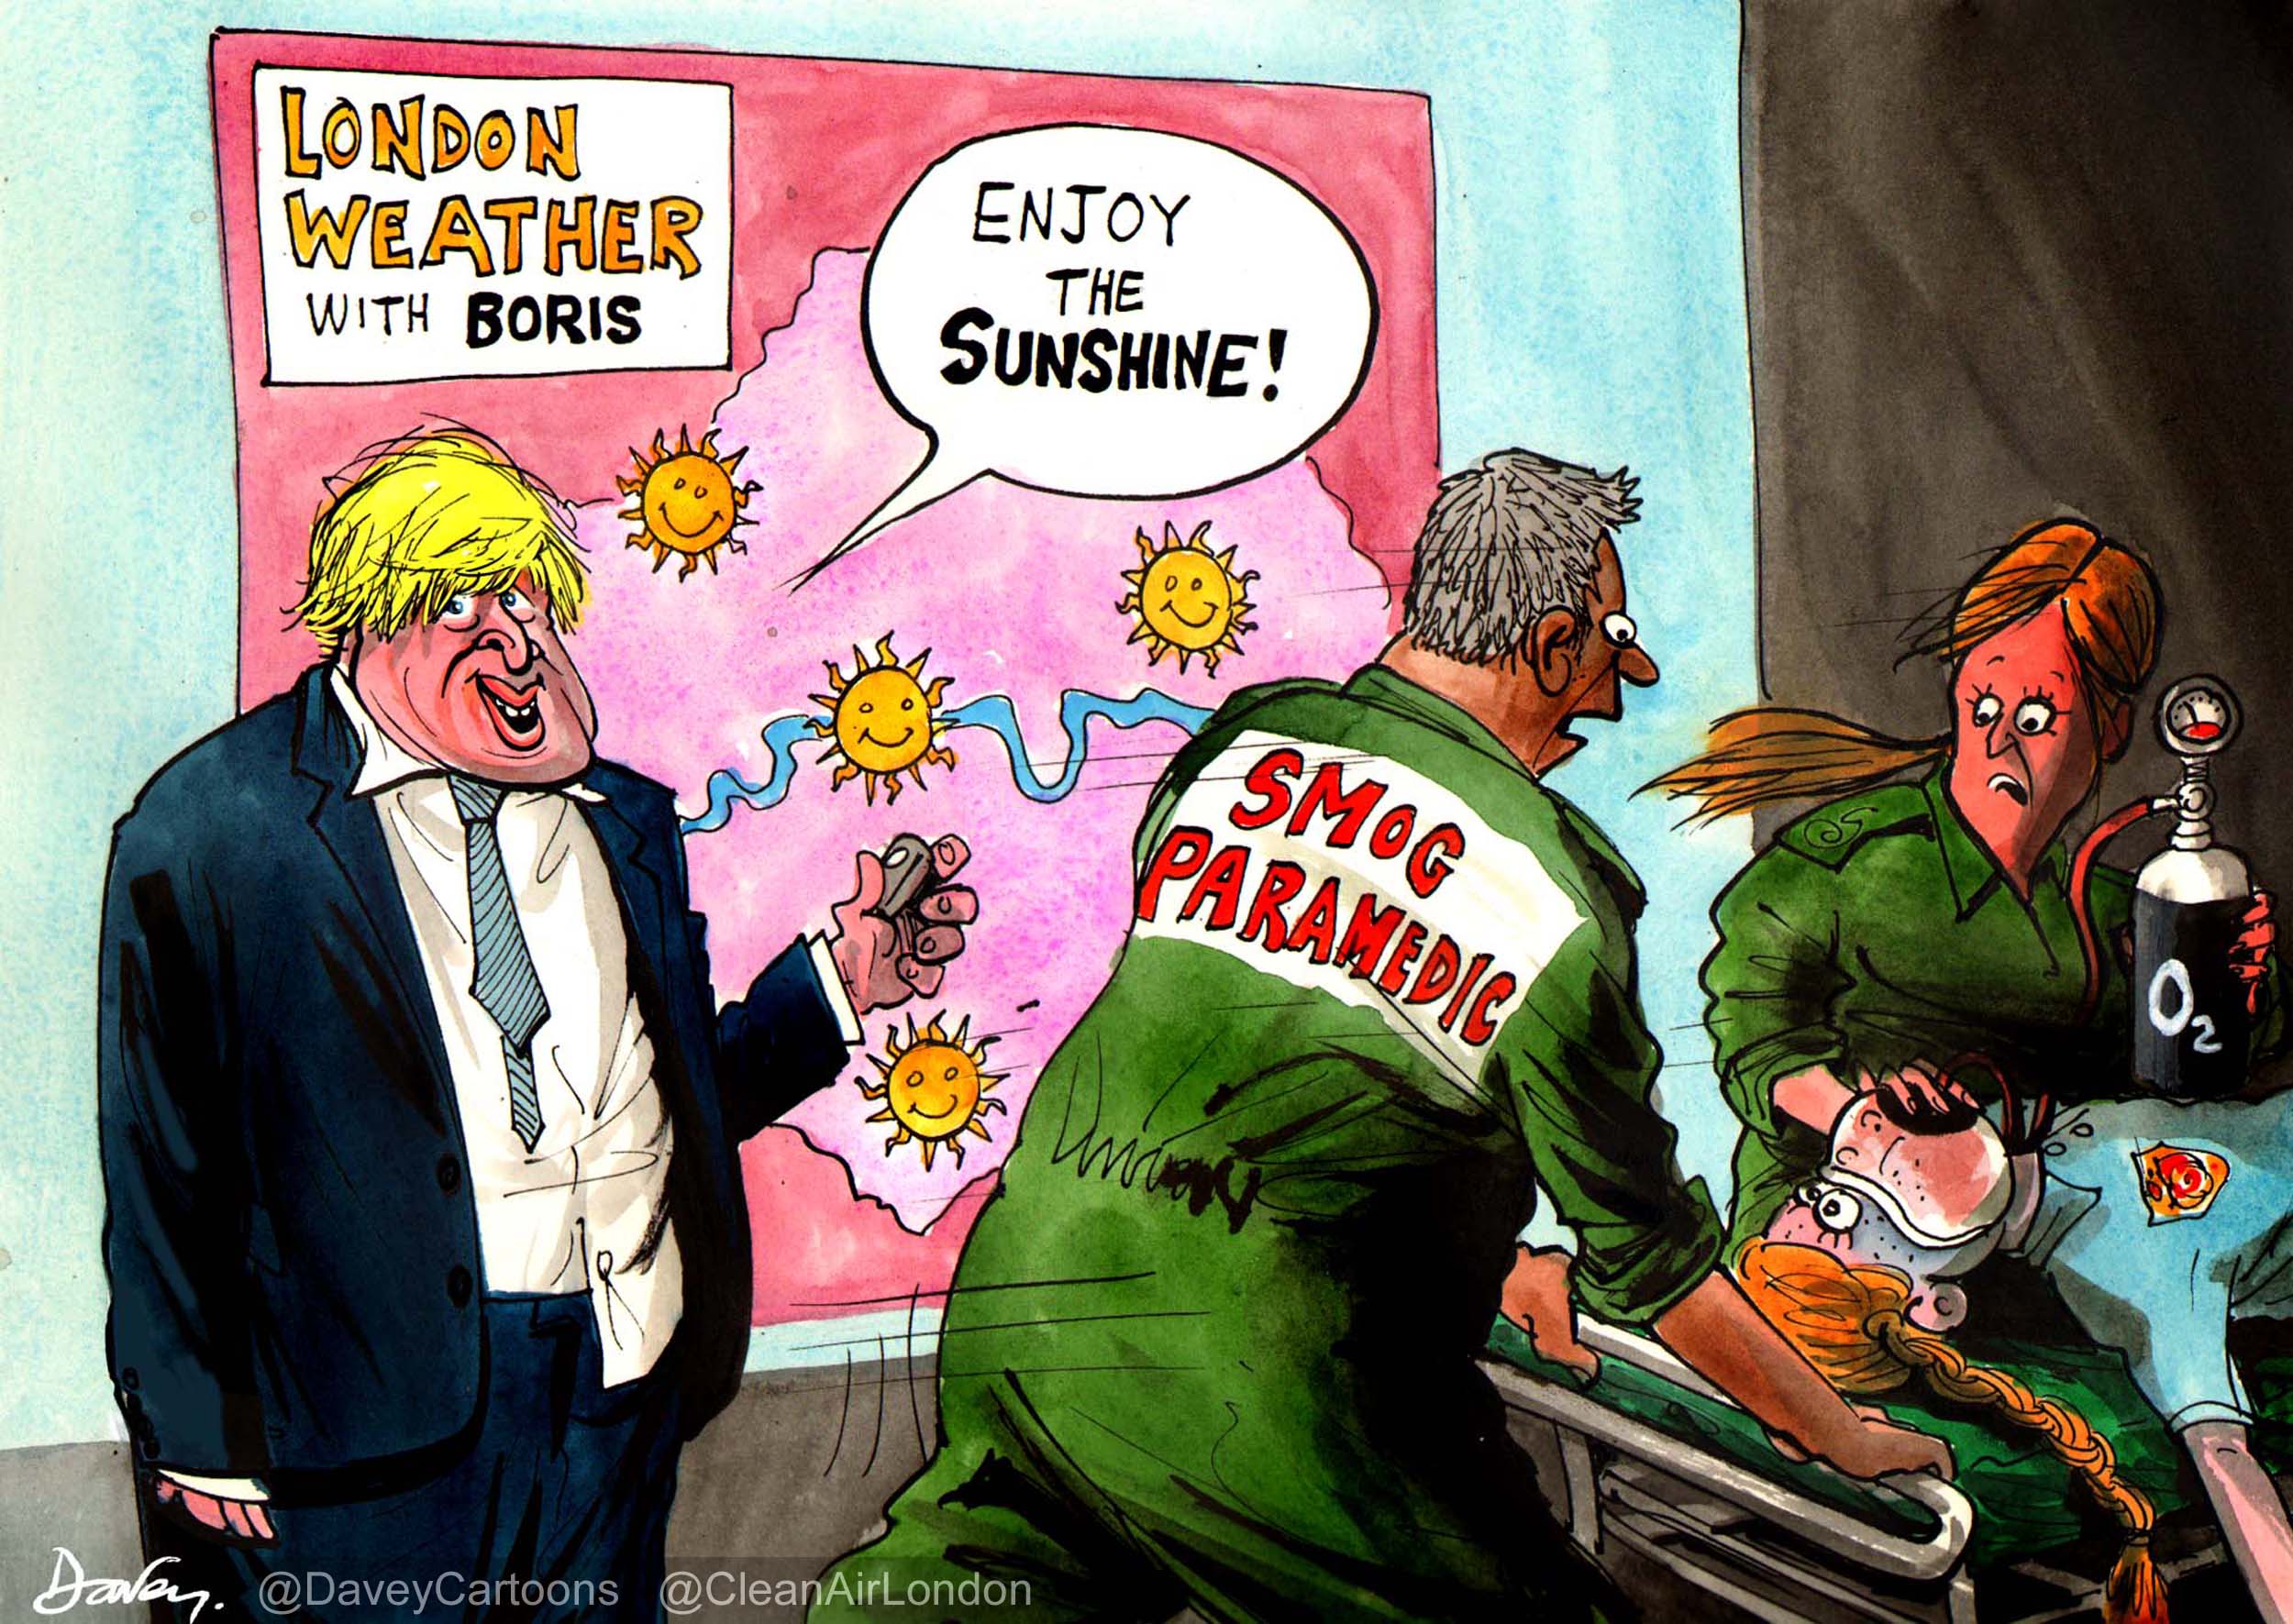
Government admits for the first time there was a serious smog episode in the days immediately leading up to the Opening Ceremony of the London 2012 Olympic Games. Scotland faces an air pollution crisis in the lead up to the Commonwealth Games in 2014 after Glasgow is reported as having the highest levels of NO2 outside London at nearly twice legal limits
‘Clean Air in London’ urges Commissioner Potočnik to launch infraction against the UK and invites Parliament’s Environment Food and Rural Affairs Committee to investigate the Government’s reporting of air pollution and lack of action to tackle to biggest public health risk after smoking
The UK has submitted its official report to the European Commission (Commission) today confirming widespread breaches of air pollution laws across the UK again in 2012. Details for the UK and Gibraltar can be seen at:
http://cdr.eionet.europa.eu/gb/eu/annualair/envukleya
http://cdr.eionet.europa.eu/gi/air/colrm_ouq/envuklgsq
Quotes
Simon Birkett, Founder and Director of Clean Air in London, said:
“Clean Air in London (CAL) urges Commissioner Potočnik to launch infraction urgently against the UK prioritising the 16 zones for which no time extension was sought for NO2 (including London) and the seven zones which have breached the terms of time extensions granted or offered for NO2.
“The Government is trying to cover-up breaches of the PM10 daily limit value in London in 2012 by dismissing some monitors and blaming ‘sea salt’ when it admits the worst particle smog episodes occurred when wind speeds were low and/or from the north of mainland Europe. The Government has confirmed again it has not consulted other Member States on significant air pollution originating in other Member States.
“CAL therefore calls on Commissioner Potočnik to launch infraction against the UK for breaching the PM10 daily limit value in London in 2012 including in Marylebone Road in Westminster, Neasden Lane in Brent (78 Bad Air Days), Horn Lane in Ealing (48 Bad Air Days), Shepherd’s Bush in Hammersmith (69 Bad Air Days) and Upper Thames Street in the City of London (53 Bad Air Days).
“This Government has tried too hard and for too long to hide the impact of air pollution. CAL invites Parliament’s Environment Food and Rural Affairs Committee to investigate the Government’s reporting of air pollution which is a national disgrace and its lack of action to tackle the biggest public health risk after smoking.”
Analysis
Key points include:
Olympic and Commonwealth Games
1. Government has admitted for the first time there was a serious smog episode in the days leading up to the Opening Ceremony of the Olympic Games (pages 65 and 66 of the full report)
2. The highest levels of NO2 in the UK outside London were reported for Glasgow at an annual mean of 72 ug/m3 i.e. nearly twice the legal limit and World Health Organisation guideline (WHO) Tab 11f.
Nitrogen dioxide
3. 34 of 43 UK zones have breached NO2 limit values in 2012 which have been in legislation since 1999 to be complied with by 1 January 2010
Pages 24/25 of the report state:
“Five [of 43] zones met the annual mean limit value for NO2 in 2012:
- Blackpool Urban Area (UK0022)
- Preston Urban Area (UK0023)
- Highland (UK0039)
- Scottish Borders (UK0040)
- Northern Ireland (UK0043)
The remaining 38 zones had locations with measured or modelled annual mean NO2 concentrations higher than the annual mean limit value (40 μg/m3).”
Note: Four zones exceeded the NO2 annual limit value but obtained limited time extensions.
4. Time extensions granted by the European Commission in June 2012 for Leicester, North Wales, Nottingham and Portsmouth to comply with the NO2 limit values have been breached again in 2012. Cardiff has now also breached the terms of its time extension. Bournemouth and Coventry have not met the terms of the conditional time extensions granted on 25 June 2012 i.e. to adjust relevant air quality plans with a view to ensuring compliance with the NO2 annual limit value by 1 January 2013 and 1 January 2014 respectively
5. Government claims Marylebone Road had the highest exceedances of NO2 at an annual mean of 94 ug/m3 Tab 11 when far higher levels were recorded at other locations e.g. Putney High Street (155 ug/m3).
6. The Government’s own report shows annual average concentrations of NO2 have not declined during the last 10 years at eight long-running traffic urban sites that include Bath Roadside, Camden Roadside, Glasgow Kerbside, Exeter Roadside, Haringey Roadside, London Marylebone Road, Oxford Centre Roadside, and Tower Hamlets Roadside) (Figure 5-6 on page 43 of the full report).
Dangerous airborne particles (PM2.5 and PM10)
7. The Government claims sea salt has reduced the number of exceedances of the PM10 daily limit value from 46 to 35 i.e. the maximum permitted level Tab 23a.
8. Government is covering-up breaches of the PM10 daily limit value in London in 2012 by ignoring some monitors and blaming ‘sea salt’ for smog episodes when it admits the worst particle smog episodes occurred when wind speeds were low and/or from the north of mainland Europe. It is misleading the European Commission yet again
9. The annual mean concentration of PM2.5 in Marylebone Road in London was 22 ug/m3 and 21 ug/m3 after the deduction of sea salt Tab 18. This exceeded the PM2.5 ‘Exposure Concentration Obligation’ (known as the Stage 2 Limit Value) of 20 ug/m3 which must be met by 1 January 2020. It is twice the WHO guideline for PM2.5.
10. The Government has confirmed the UK has not consulted other Member States on significant air pollution originating in other Member States Tab 25a.
Hundreds of thousands of people affected
11. 246,179 people at background locations alone, including 229,147 in London, were exposed to levels of NO2 exceeding the legal limit and the WHO guideline in 2012. The UK has refused for many years to comply with Article 5 of the 4th daughter directive requiring it to estimate the total number of people exposed to such levels of air pollution i.e. including urban roadsides Tab 19b.
12. International health standards have been exceeded for exposure to benzo(a)pyrene (76,777 people affected in the Belfast, North East, Northern Ireland, North Wales, South Wales, Swansea, Teeside, Yorkshire and Humberside zones) Tab 19k, nickel (3,286 people affected in the Swansea and South Wales zones) Tab 19j and ozone (millions of people affected) Tab 19g. In Gibraltar, 29,752 people were exposed to levels of nickel exceeding international health standards Tab 14c due to local industry including power production.
http://cdr.eionet.europa.eu/gb/eu/annualair/envukleya
CAL 256 air_pollution_uk_2012_issue_1_Full report
CAL 256 AQD_DD4_2012mapsrepv0_Published 231213
CAL 256 1312171443_AQD_DD4_Assessment_Threshold_report 171213
CAL 256 Particulate matter from natural sources and related reporting_EEA 110712
CAL 256 Defra air_pollution_uk_2012_Compliance_Assessment_SummaryCAL 256 Defra
2012_Review_of_air_quality_monitoring_station_classifications
CAL 256 David_Green_New_measurements_of_PM_composition_during_pollution_episodes
CAL 256 Gibraltar Gib_natural_quantification_2011_v2
CAL 256 Gibraltar_Quantification_of_the_contribution_of_sea_salt_final September 2012
CAL 199 Defra response to CAL re EU Pilot 200812
7th Environment Action Programme (20 November 2013)
http://ec.europa.eu/environment/newprg/pdf/PE00064_en.pdf
Mayor’s estimate of Londoners exceeding exposed to NO2 exceeeding limit values (based on LAEI 2010)
CAL 256 GLA breakdown of NO2 by borough to 2020 based on LAEI 2010
CAL 256 UK AQ Zones and AQ as reported September 2013_Updated draft 311213
Notes
1. European Commission’s time extension webpage
http://ec.europa.eu/environment/air/quality/legislation/time_extensions.htm
2. Requirement to report total population exposed to air pollution exceeding limit values
http://rod.eionet.europa.eu/obligations/569
3. European Environment Agency report in 2012 titled ‘Particulate matter from natural sources and related reporting under the EU Air Quality Directive in 2008 and 2009’ stated:
“Since sea salt (mainly NaCl) is quantitatively the major contributor to the marine aerosol mass, it is the component to be considered when evaluating the natural contribution of marine aerosol to PM levels. Sea aerosols in the atmosphere tend to occur as episodic events during strong winds. They are most relevant for the PM10 daily mean limit values: discounting the sea salt contribution can have an impact on the calculation of the exceedances of the daily limit value for PM10.” Page 19
“Given the nature of sea-salt contributions, it is somewhat surprising that this type of event was only reported by two Member States (France and the United Kingdom)” page 29
“Possible clarifications hinge also on whether sodium nitrate (NaNO3) is regarded as ‘natural’ or anthropogenic. In practice, the sodium is likely to come from natural origins (sea spray) and the nitrate from anthropogenic origins (NOx oxidation)” (page 35)
“The UK applied a modelling approach” (pages 31 and 32)
4. Exceedance of the NO2 annual mean limit value in Putney in 2012
5. Exceedances of the PM10 daily limit value in 2012
Neasden Lane
Horn Lane
Shepherd’s Bush
Upper Thames Street
6. London Air Quality Network annual conference on 28 June 2012
See presentation by David Green titled ‘New measurements of PM composition during pollution episodes
http://www.londonair.org.uk/london/asp/LAQNSeminar/
ENDS

