Hillingdon tops ‘National list of shame’ for increase in deaths attributable to air pollution (PM2.5). Gateshead tops ‘National list of fame’ with the death rate falling by 0.72% to 4.18%
Death rate worsened in 15 of 33 boroughs in London and 18 of 119 other local areas in England. No London boroughs made it into the ‘National list of fame’. The City of London remains the worst area with 8.94% of total deaths attributable to PM2.5 followed by the City of Westminster
Clean Air in Cities app reports the health impact of long-term exposure to PM2.5 on populations in local areas, regions and England as a whole. It can be downloaded at http://itun.es/i6xj69k
The Department of Health has published the Public Health Indicator for the fraction of mortality attributable to human-made (i.e. anthropogenic) dangerous airborne particles (PM2.5) in 2011. The new statistics show the first trends in the ‘attributable fraction’ since the statistics were introduced for 2010.
Hillingdon tops the ‘National list of shame’ with the percentage of deaths attributable to air pollution increasing by 0.36% to 6.86% (attributable fraction). Despite a small improvement since 2010, the City of London is still the worst local area in England with 8.94% with the City of Westminster and the Royal Borough of Kensington and Chelsea second and third on 8.32% and 8.27% respectively. England as a whole showed a small improvement from 5.60% to 5.36%. Topping the ‘National list of fame’ is Gateshead where the attributable fraction reduced by 0.72% to 4.18%.
These statistics exclude the health impact of air pollution from non-anthropogenic sources e.g. Sahara dust. The Department for Environment Food and Rural Affairs (Defra) estimated non-anthropogenic PM2.5 at 1.6 micrograms per cubic metre (mg/m3) in England in 2010. In September 2012 Defra reported to the European Commission that total PM2.5 levels in the UK increased from 12.5 mg/m3 in 2009 to 13.0 mg/m3 in 2010 and 13.5 mg/m3 in 2011. Arithmetically, the attributable fraction for England would therefore have increased not fallen unless Defra increased its estimate of non-anthropogenic PM2.5 between 2010 and 2011 or air pollution had increased significantly in Northern Ireland, Scotland and/or Wales. Oversimplifying, the number of attributable deaths is 6% of all deaths in an area for every 10 mg/m3 of total annual PM2.5 (or anthropogenic PM2.5)e.g. 6% times 50,000 equals 3,000.
The free ‘Clean Air in Cities’ app uses this data to report the health impact of long-term exposure to PM2.5 on populations in local areas, regions and England as a whole. It can be downloaded at http://itun.es/i6xj69k. Its estimates are based on the Public Health Indicators for 2010 and will be updated for 2011 once further data is available. Some 1,400 people have downloaded the App.
Quotes
Simon Birkett, Founder and Director of Clean Air in London, said:
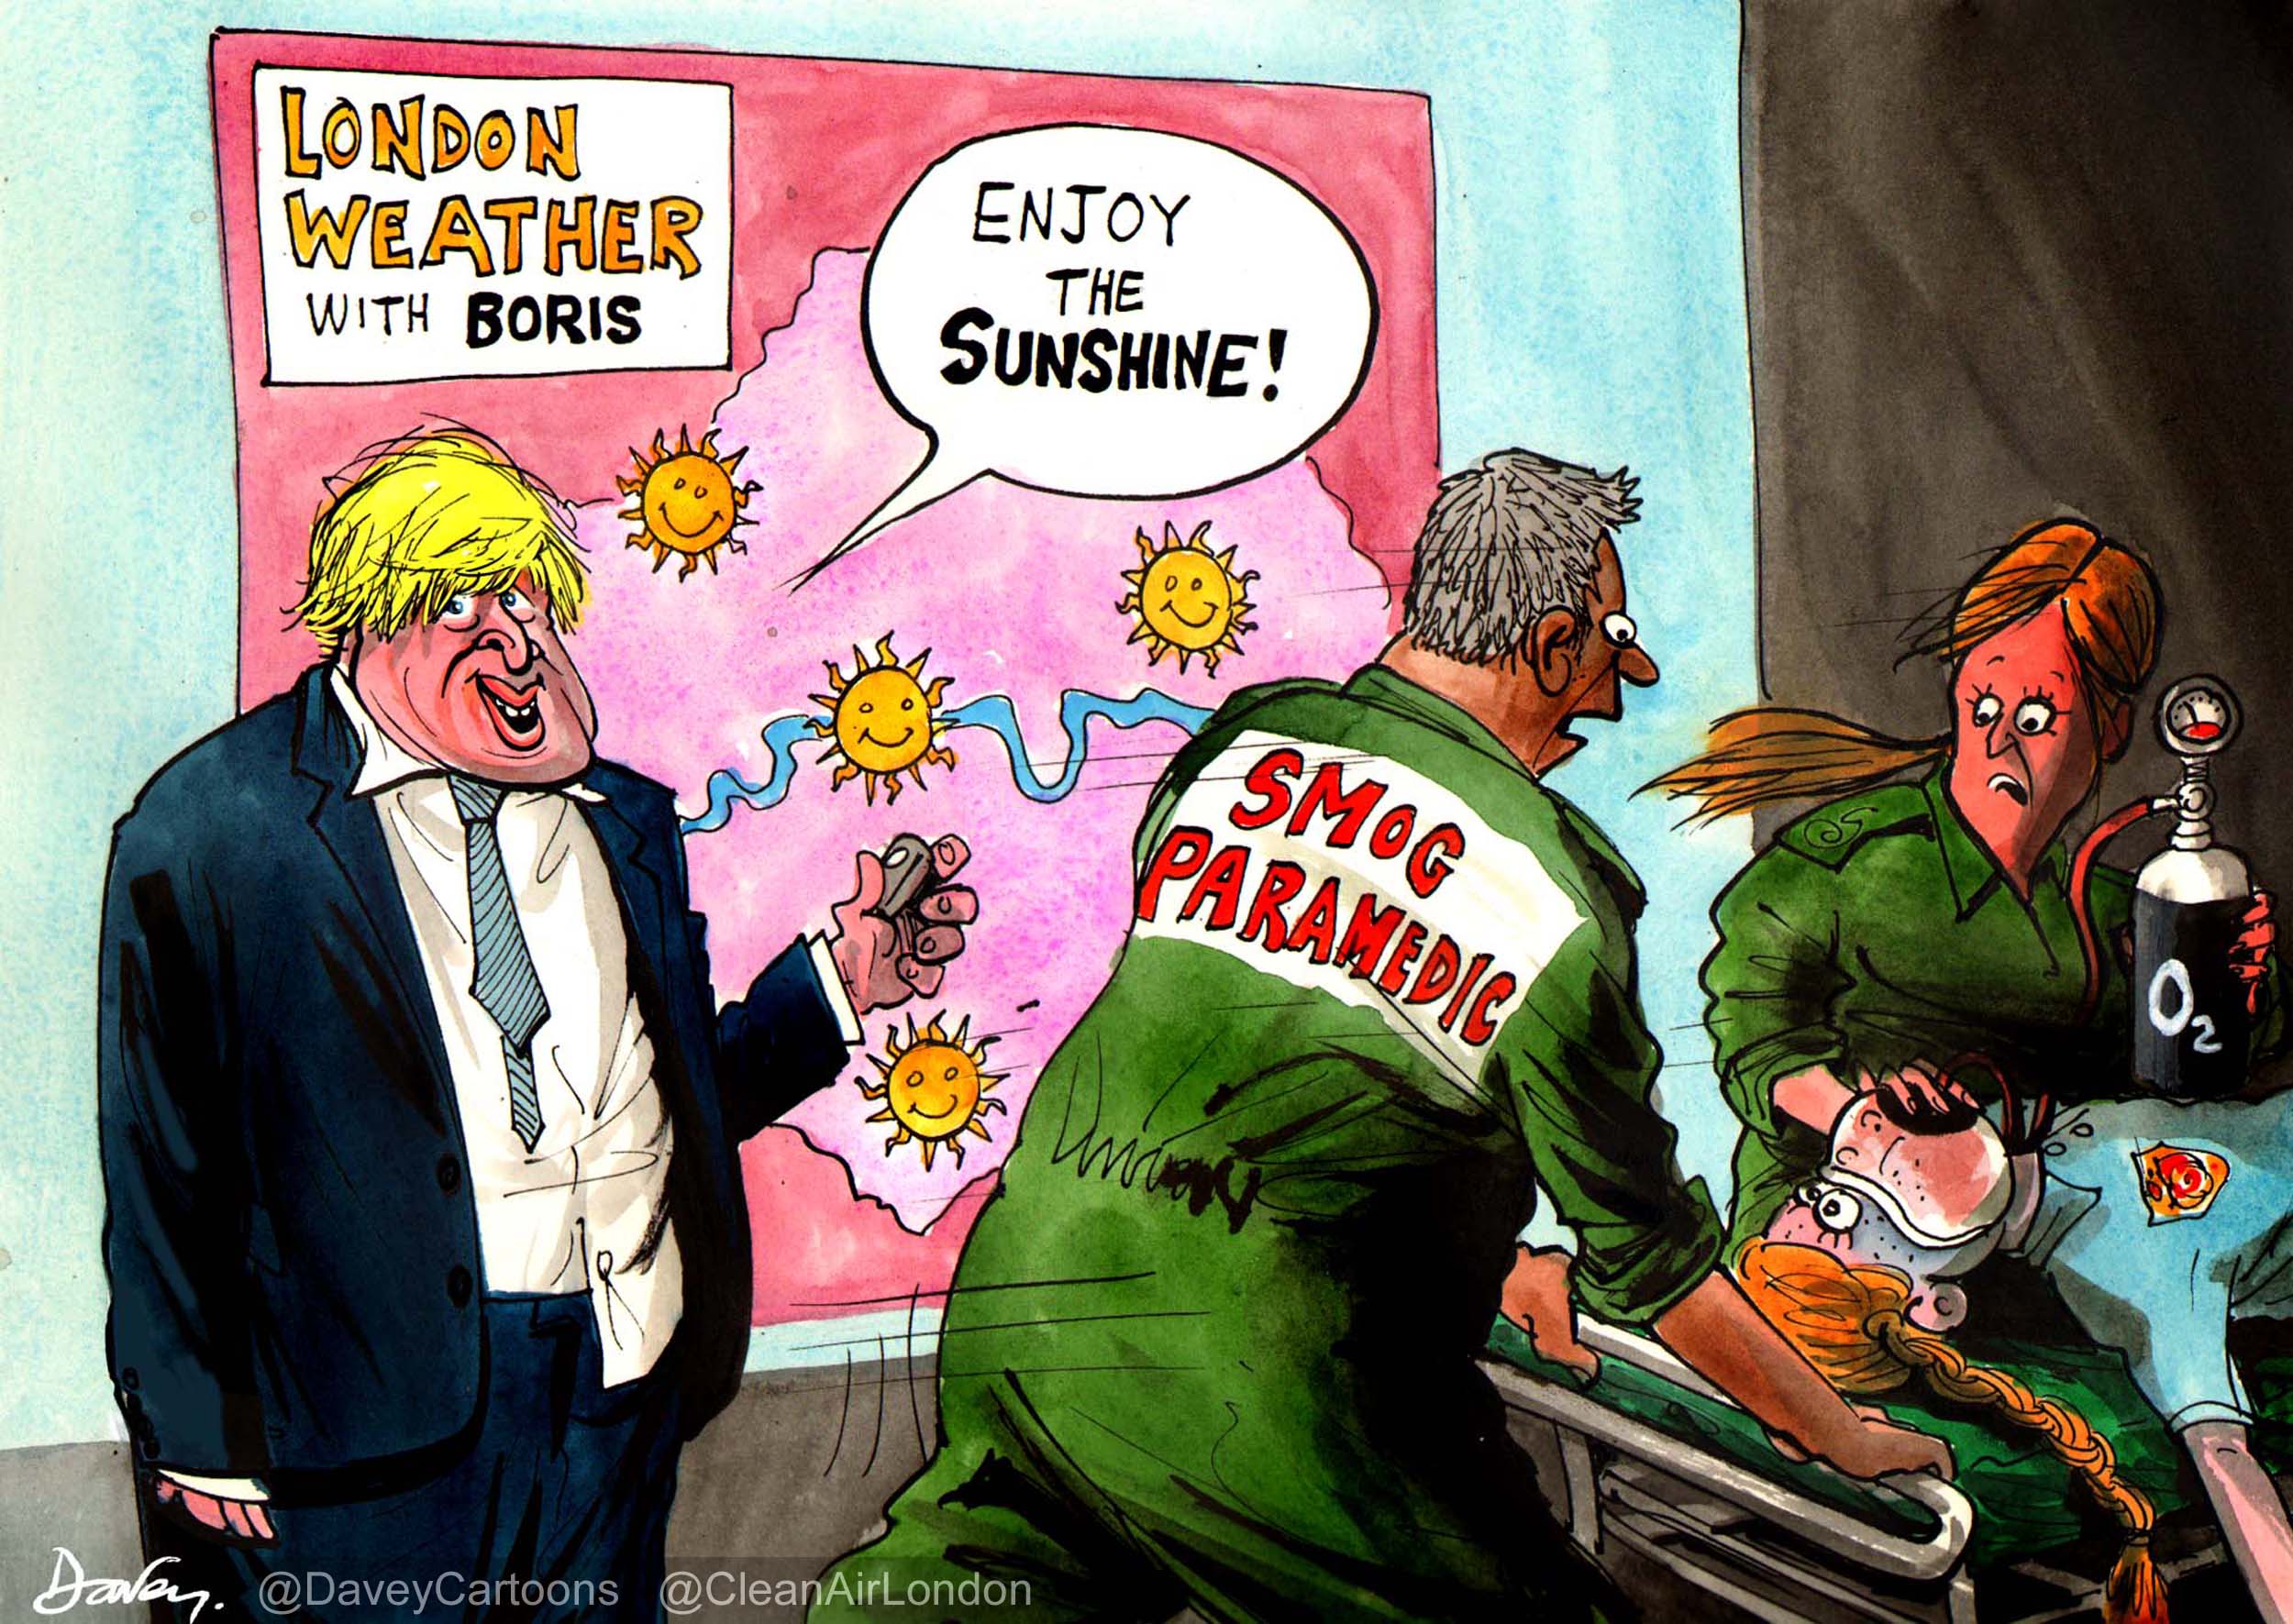
“It is shocking to discover late in the ‘Year of Air’, and nearly six years into the Mayor’s term of office, that human-made air pollution (PM2.5) killed more people in 15 London boroughs in 2011 than 2010 and far more than 10 times the number dying from road traffic accidents.
“Department of Health estimates of deaths attributable to air pollution concentrations are much closer to revealing the true health impact of air pollution on Londoners than the Mayor’s claims, based on computer modelling, that emissions of PM10 in London have reduced by 15% since 2008 (and oxides of nitrogen by 20%).
“Clean Air in London applauds Public Health England, the Committee on the Medical Effects of Air Pollution and the Department of Health for publishing these statistics about air pollution – the biggest public health risk after smoking. We also applaud the greater precision of the statistics this year. We would like to see the number of ‘attributable deaths’ and the ‘years lost’ for each borough as long-promised by the Department of Health and highlighted by Lord Berkeley recently and in a July debate on this subject in the House of Lords led by Lord Winston.
“This new evidence raises many questions. For example: what is the status of ‘discussions’ between Public Health England and the Department of Health about the comparability of mortality estimates for different risk factors; what was Defra’s estimate of non-human-made air pollution in England in 2011 compared to 2010 and did that change affect its claims of complying with legal limits in 2011; why is there such disparity between the Mayor’s claims of air pollution reductions and health impacts; and most important why are the Mayor and nearly half of London Councils allowing the health impact of air pollution to worsen? These matters need to be debated urgently in Parliament, the London Assembly and Council chambers.
“It is blindingly obvious now why Defra launched a consultation in the depths of the summer holidays about its plans that would scrap the local monitoring and reporting of air pollution and remove fundamental protections in the planning system. The Government wants to ignore this public health crisis. Barry Gardiner MP has been leading the Parliamentary fight against this insanity.
“With diesel exhaust at the heart of this catastrophe, there can be no stronger reminder why the Mayor and local authorities must:
- catch up with Berlin which banned the oldest diesel vehicles of all sorts from the most polluted places nearly four years ago and is expected to tighten its standard again in 2015;
- give taxi drivers free choice so they are not forced to buy one or other of two large diesel vehicles and champion an incentive scheme to update the entire London taxi fleet by 2016;
- fit filters to thousands not hundreds of London buses;
- build a ‘fast charge’ electric network; and
- outlaw the removal of factory-fitted diesel particulate filters which is poisoning our streets.
“London should be leading the world in tackling air pollution not suffocating in a smoky pit. Three cheers for the boroughs fighting to lead the way.”
Notes
1. Clean Air in Cities IndexTM (or Birkett IndexTM) reports the health impact on the population of long-term exposure to air pollution. In particular, it illustrates CAL’s view of the potential health impact of long-term exposure to different annual mean concentrations of total PM2.5. The index starts at zero and increases in 10 bands of 2.0 micrograms per cubic metre (µg/m3) to 20 µg/m3 in population-weighted exposure to total PM2.5 in a local area or region. The WHO guideline is 10µg/m3 for total PM2.5 but the WHO has found no safe level of human exposure down to 8 µg/m3 or below. CAL has therefore chosen bands of LOW (zero to 6.0 µg/m3), MODERATE (6.1 µg/m3 to 12.0 µg/m3), HIGH (12.1 µg/m3 to 18.0 µg/m3) and VERY HIGH (18.1 µg/m3 to 20.0 µg/m3). On this basis, the WHO guideline is at the top of the middle of the three sub-bands within the MODERATE band. The App does not estimate or display the number of actual deaths from air pollution or the risk for an individual.
More about the free Clean Air in Cities app:
https://cleanair.london/health/clean-air-in-cities-index/
The underlying data for 2010 can be seen at:
2. Public Health Outcomes Framework definitions
3. COMEAP statement on comparing public health risks in October 2013
The Committee on the Medical Effects of Air Pollution (COMEAP) stated:
“We have been asked whether the methods used to develop estimates of the mortality burden, in a given year, associated with long-term exposure to current levels of particulate air pollution are similar to those used to calculate mortality (in a given year) attributable to other common public health risk factors such as smoking, obesity and alcohol.
“Discussions with [the Department of Health] analysts suggest that, in most cases, the methodological approaches used are similar. Exceptions are statistics for diseases which are wholly attributable to a single risk factor (a notable example being alcohol and deaths from alcoholic liver disease). However, there are some differences in the language used to communicate the results.
“COMEAP has no plans to change its preferred formulation for describing the mortality burden attributable to long-term exposure to particulate air pollution as “equivalent to” a given number of deaths (in a given year) together with information on the life lost to the population. This reflects the characteristics of air pollution as a contributory factor to mortality risk at ages at which deaths typically occur.”
Agenda for COMEAP meeting on 5 December 2013
http://www.comeap.org.uk/images/stories/Documents/Minutes_and_Agendas/Agenda_Nov_2013.pdf
4. Annual report to European Commission in September 2012 (see tab 28)
http://cdr.eionet.europa.eu/gb/eu/annualair/envugvtza
5. Mayor’s claims of emissions reductions [based on computer modelling assumptions]
“Since 2008 emissions of PM10 and PM2.5 have been reduced by 15 per cent. Emissions of NOx (an umbrella term which includes NO2) have been reduced by 20 per cent.” 13 February 2013
http://questions.london.gov.uk/QuestionSearch/searchclient/questions/question_46224
6. European Commission’s ‘Year of Air’ in 2013
http://ec.europa.eu/environment/air/review_air_policy.htm
http://europa.eu/rapid/press-release_SPEECH-13-822_en.htm
https://cleanair.london/ai1ec_event/closing-conference-european-year-of-air/?instance_id=139
7. Parliamentary Questions
http://www.theyworkforyou.com/wrans/?id=2013-08-29a.306.1
http://www.theyworkforyou.com/wrans/?id=2013-10-28a.172711.h
http://www.theyworkforyou.com/wrans/?id=2012-07-02a.114222.h
http://www.theyworkforyou.com/lords/?id=2013-07-22a.1043.0
http://www.theyworkforyou.com/wrans/?id=2013-11-01a.172982.h
8. Mortality Statistics: Deaths Registered in England and Wales by Area of Usual Residence, 2011
There were 452,862 deaths registered in England by area of usual residence in 2011 (all ages) and 461,017 in 2010. Clean Air in London estimates the attributable fraction of 5.36% resulted in 24,273 deaths attributable to PM2.5 in England in 2011 and 25,817 in 2010 i.e. 5.60% of 461,017 in 2010 (assuming a consistent approach by Defra to calculating non-anthropogenic PM2.5).
http://www.ons.gov.uk/ons/publications/re-reference-tables.html?edition=tcm%3A77-275375
9. ‘National list of shame’ (local areas in England where the attributable fraction % increased)
NOTE: DOWNLOAD PDF VERSION TOP RIGHT OF THIS UPDATE FOR AN EASIER TO READ TABLE
|
2010 |
2011 |
||||
|
1 |
Hillingdon |
0.36 |
6.50 |
6.86 |
|
|
2 |
Harrow |
0.29 |
6.40 |
6.69 |
|
|
3 |
Brent |
0.28 |
7.20 |
7.48 |
|
|
4 |
Enfield |
0.28 |
6.60 |
6.88 |
|
|
5 |
Hertfordshire |
0.25 |
5.80 |
6.05 |
|
|
6 |
Barnet |
0.24 |
6.80 |
7.04 |
|
|
7 |
Haringey |
0.22 |
7.10 |
7.32 |
|
|
8 |
West Sussex |
0.22 |
5.00 |
5.22 |
|
|
9 |
Camden |
0.21 |
7.70 |
7.91 |
|
|
10 |
Buckinghamshire |
0.20 |
5.60 |
5.80 |
|
|
11 |
Brighton and Hove |
0.18 |
5.40 |
5.58 |
|
|
12 |
Islington |
0.18 |
7.90 |
8.08 |
|
|
13 |
Windsor and Maidenhead |
0.17 |
5.90 |
6.07 |
|
|
14 |
Hackney |
0.16 |
7.80 |
7.96 |
|
|
15 |
Central Bedfordshire |
0.15 |
5.50 |
5.65 |
|
|
16 |
East Sussex |
0.15 |
4.80 |
4.95 |
|
|
17 |
Surrey |
0.15 |
5.70 |
5.85 |
|
|
18 |
Wokingham |
0.15 |
5.70 |
5.85 |
|
|
19 |
Reading |
0.13 |
5.90 |
6.03 |
|
|
20 |
Bracknell Forest |
0.12 |
5.60 |
5.72 |
|
|
21 |
Ealing |
0.12 |
7.20 |
7.32 |
|
|
22 |
Hampshire |
0.11 |
5.30 |
5.41 |
|
|
23 |
Southampton |
0.11 |
6.20 |
6.31 |
|
|
24 |
Redbridge |
0.09 |
7.00 |
7.09 |
|
|
25 |
Bedford |
0.08 |
5.50 |
5.58 |
|
|
26 |
Waltham Forest |
0.08 |
7.30 |
7.38 |
|
|
27 |
West Berkshire |
0.05 |
5.50 |
5.55 |
|
|
28 |
Slough |
0.04 |
6.80 |
6.84 |
|
|
29 |
Havering |
0.03 |
6.30 |
6.33 |
|
|
30 |
Hounslow |
0.03 |
7.10 |
7.13 |
|
|
31 |
Luton |
0.03 |
6.40 |
6.43 |
|
|
32 |
Westminster |
0.02 |
8.30 |
8.32 |
|
|
33 |
Portsmouth |
0.01 |
5.90 |
5.91 |
‘National list of fame’ (where the attributable fraction % reduced by more than 0.5%)
NOTE: DOWNLOAD PDF VERSION TOP RIGHT OF THIS UPDATE FOR AN EASIER TO READ TABLE
|
2010 |
2011 |
||||
|
1 |
Gateshead |
-0.72 |
4.90 |
4.18 |
|
|
2 |
Sandwell |
-0.71 |
6.90 |
6.19 |
|
|
3 |
Blackpool |
-0.66 |
4.30 |
3.64 |
|
|
4 |
Sunderland |
-0.66 |
5.00 |
4.34 |
|
|
5 |
Wirral |
-0.66 |
4.70 |
4.04 |
|
|
6 |
Liverpool |
-0.65 |
5.40 |
4.75 |
|
|
7 |
Halton |
-0.63 |
5.50 |
4.87 |
|
|
8 |
North East Lincolnshire |
-0.63 |
5.60 |
4.97 |
|
|
9 |
Cumbria |
-0.61 |
3.60 |
2.99 |
|
|
10 |
South Tyneside |
-0.58 |
5.00 |
4.42 |
|
|
11 |
Knowsley |
-0.57 |
5.50 |
4.93 |
|
|
12 |
Newcastle upon Tyne |
-0.57 |
4.90 |
4.33 |
|
|
13 |
Dudley |
-0.56 |
5.90 |
5.34 |
|
|
14 |
Middlesborough |
-0.56 |
5.00 |
4.44 |
|
|
15 |
Blackburn with Darwen |
-0.56 |
5.10 |
4.54 |
|
|
16 |
St Helens |
-0.56 |
5.50 |
4.94 |
|
|
17 |
Stockport |
-0.55 |
5.70 |
5.15 |
|
|
18 |
County Durham |
-0.54 |
4.30 |
3.76 |
|
|
19 |
Trafford |
-0.54 |
5.60 |
5.06 |
|
|
20 |
Warrington |
-0.54 |
5.40 |
4.86 |
|
|
21 |
Hartlepool |
-0.53 |
4.70 |
4.17 |
|
|
22 |
Derby |
-0.53 |
6.10 |
5.57 |
|
|
23 |
Redcar and Cleveland |
-0.52 |
4.50 |
3.98 |
|
|
24 |
Birmingham |
-0.50 |
6.40 |
5.90 |
|
|
25 |
Northumberland |
-0.50 |
3.90 |
3.40 |
|
|
26 |
Nottingham |
-0.50 |
6.40 |
5.90 |
|
|
27 |
North Tyneside |
-0.50 |
4.80 |
4.30 |
|
| Herefordshire, County of |
10.59% |
4.50 |
4.02 |
||
| Darlington |
10.56% |
4.50 |
4.02 |
10. London ranking (Positive = increase in attributable fraction %; Negative = reduction in attributable fraction %)
NOTE: DOWNLOAD PDF VERSION TOP RIGHT OF THIS UPDATE FOR AN EASIER TO READ TABLE
|
2010 |
2011 |
||||
|
1 |
Hillingdon |
0.36 |
6.50 |
6.86 |
|
|
2 |
Harrow |
0.29 |
6.40 |
6.69 |
|
|
3 |
Brent |
0.28 |
7.20 |
7.48 |
|
|
4 |
Enfield |
0.28 |
6.60 |
6.88 |
|
|
5 |
Barnet |
0.24 |
6.80 |
7.04 |
|
|
6 |
Haringey |
0.22 |
7.10 |
7.32 |
|
|
7 |
Camden |
0.21 |
7.70 |
7.91 |
|
|
8 |
Islington |
0.18 |
7.90 |
8.08 |
|
|
9 |
Hackney |
0.16 |
7.80 |
7.96 |
|
|
10 |
Ealing |
0.12 |
7.20 |
7.32 |
|
|
11 |
Redbridge |
0.09 |
7.00 |
7.09 |
|
|
12 |
Waltham Forest |
0.08 |
7.30 |
7.38 |
|
|
13 |
Havering |
0.03 |
6.30 |
6.33 |
|
|
14 |
Hounslow |
0.03 |
7.10 |
7.13 |
|
|
15 |
Westminster |
0.02 |
8.30 |
8.32 |
|
|
16 |
Kingston upon Thames |
0.00 |
6.70 |
6.70 |
|
|
17 |
Sutton |
-0.02 |
6.40 |
6.38 |
|
|
18 |
Kensington and Chelsea |
-0.03 |
8.30 |
8.27 |
|
|
19 |
Newham |
-0.03 |
7.60 |
7.57 |
|
|
20 |
Tower Hamlets |
-0.03 |
8.10 |
8.07 |
|
|
21 |
Hammersmith |
-0.04 |
7.90 |
7.86 |
|
|
22 |
Richmond upon Thames |
-0.04 |
6.80 |
6.76 |
|
|
23 |
City of London |
-0.06 |
9.00 |
8.94 |
|
|
24 |
Wandsworth |
-0.07 |
7.30 |
7.23 |
|
|
25 |
Croydon |
-0.09 |
6.50 |
6.41 |
|
|
26 |
Merton |
-0.09 |
6.90 |
6.81 |
|
|
27 |
Bexley |
-0.12 |
6.60 |
6.48 |
|
|
28 |
Barking and Dagenham |
-0.14 |
7.10 |
6.96 |
|
|
29 |
Bromley |
-0.16 |
6.30 |
6.14 |
|
|
30 |
Lambeth |
-0.16 |
7.70 |
7.54 |
|
|
31 |
Southwark |
-0.18 |
7.90 |
7.72 |
|
|
32 |
Lewisham |
-0.19 |
7.20 |
7.01 |
|
|
33 |
Greenwich |
-0.25 |
7.20 |
6.95 |
11. According to the Mayor of London’s Air Quality Strategy around 80% of PM2.5 emissions in London are generated by road transport.
http://www.london.gov.uk/priorities/environment/publications/mayors-air-quality-strategy
Policy Exchange has estimated that diesel vehicles were responsible for 91% of PM2.5 exhaust emissions in 2009. Inequalities are a particular concern:
‘Clean Air in London’ investigation into diesel exhaust in London:
12. Salus populi suprema lex esto
“The health of the people should be the supreme law,” “Let the good of the people be the supreme law” or “The welfare of the people shall be the supreme law” is found in Cicero’s De Legibus (book III, part III, sub. VIII), as Ollis salus populi suprema lex esto. The Commissioned Officers Association of the U.S. Public Health Service has adopted the phrase as its motto.
http://en.wikipedia.org/wiki/Salus_populi_suprema_lex_esto
13. The words Clean Air in LondonTM, Clean Air in Cities IndexTM and Birkett IndexTM along with their associated logos are trademarks or registered trademarks of Clean Air in London, a company limited by guarantee, registered in England and Wales, with company number 7413769.
14. iPad and iPhone are trademarks of Apple Inc., registered in the U.S. and other countries. App Store is a service mark of Apple Inc.
CAL 261 List of shame and fame_Full_061113
© Clean Air in London 2013