Information obtained using powerful European access to environmental information laws despite obstruction by Defra. Mayor continues to hide more precise information by making it inaccessible to anyone without access to complex and expensive computer software
Every London borough is listed among the Mayor’s Air Quality Focus Areas. Highest modelled levels of air pollution are: over three times the World Health Organisation (WHO) guideline and legal limit for nitrogen dioxide (NO2); and over twice the WHO guideline for dangerous airborne particles (PM2.5). Diesel exhaust is the main local source of such air pollution
Clean Air in London urges the Mayor to publish estimated actual concentrations of NO2, PM2.5 and PM10 at each Air Quality Focus Area within two months after each calendar year end so Londoners can assess his progress. His claims of modelled emission reductions are meaningless
Clean Air in London (CAL) has obtained from the Department for Environment Food and Rural Affairs (Defra) modelled annual mean concentrations of nitrogen dioxide (NO2) and dangerous airborne particles (PM2.5 and PM10) in 2012 at or nearest to the Mayor’s 187 Air Quality Focus Areas in London. This information has never been published before. The Mayor has repeatedly refused to publish the more precise information he holds.
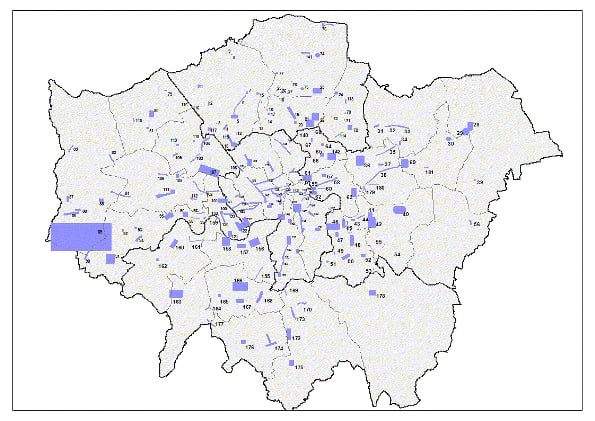
The Mayor selected 187 Air Quality Focus Areas in London by July 2013 Note 1. These are locations that not only exceed the European Union annual mean limit value for NO2 but are also locations with high human exposure. The Focus Areas were defined to address concerns raised by boroughs within the Local Air Quality Management review process and forecasted air pollution trends. It is not an exhaustive list of London’s hotspot locations, but where the Greater London Authority believes the problem to be most acute. There is some overlap with the 50 worst road links for annual mean NO2 concentrations in 2012 found by The Sunday Times (all of which are in London).
The Mayor repeatedly refused requests from Jenny Jones AM (Green), Darren Johnson AM (Green) and Stephen Knight AM (Liberal Democrat) to disclose air pollution levels at the worst locations in London and/or at the Air Quality Focus Areas Note 4. On 26 February 2014, CAL therefore asked Defra for data on air pollutants at these locations. CAL’s request was originally refused but the information has now been released after CAL modified its request slightly and called for an internal review of Defra’s refusal decision on 23 March. Defra missed the two month statutory deadline to complete the internal review and failed to respond until 22 July 2014. Defra has apologised for this failing. Defra says that its modelled air pollution concentrations at 47 of the 187 locations may not be representative of levels at the Air Quality Focus Area because they are more than 50 metres from it.
The Mayor’s modelling of air pollution in London was carried out by King’s College London using a 20 metre square grid. In contrast, Defra reports the air pollution values for 1 kilometre grid squares and road links. Defra has therefore provided the air pollution concentrations at the road links at or nearest to each of the 187 Air Quality Focus Areas. These concentrations are estimated based on computer modelling of emissions and may differ significantly from actual air pollution. Oxford Street is a good example, where Defra’s modelled annual mean concentration of NO2 is 92 micrograms per cubic metre (ug/m3) for 2012 compared to the actual average monitored concentration of 135 ug/m3 so far in 2014. We know already from top scientists at King’s College London that Oxford Street may have the highest officially monitored levels of NO2 anywhere in the world (and it is the only ‘modern’ air pollution gas regulated unlike particles which are regulated as a ‘lump’).
The Defra data shows there are staggeringly high levels of air pollution at these locations with high human exposure. Levels of NO2 are over three times the World Health Organisation (WHO) guideline and EU legal limit and PM2.5 over twice the WHO guideline. The main local source of air pollution at these hotspots is almost certainly diesel exhaust.
This information request has highlighted the importance of asking precise questions of public authorities that will require little or no judgement to answer. Campaigners might try asking Defra ([email protected]) or Transport for London ([email protected]) or the Mayor ([email protected]) in future for:
“Please tell me the [insert number e.g. 50] highest modelled annual mean concentrations held by [Defra] for each of nitrogen dioxide (NO2) and dangerous airborne particles (PM2.5 and PM10) in [insert local authority name or other place] for the latest available calendar year together with the description and grid reference for each location e.g. a named road link.”
Defra is allowed up to 40 working days to respond to such requests.
Clean Air in London has been advised in this matter by barristers Gerry Facenna and Julianne Morrison of Monckton Chambers.
Quotes
Simon Birkett, Founder and Director of Clean Air in London, said:
“It is shocking that the Mayor continues to hide air pollution levels at the most acute locations and that Defra has taken five months to release data for the nearest locations it holds.
“Air pollution levels at these locations are up to two and three times legal limits and World Health Organisation guidelines. Diesel exhaust is almost certainly the main local source of this air pollution.
“Boris misleads people by talking about reductions in computer modelled emissions. Actual air pollution concentrations, used for setting health and legal limits, are the real test. Clean Air in London urges the Mayor to publish estimated actual concentrations of NO2, PM2.5 and PM10 at each Air Quality Focus Area within two months after each calendar year end so Londoners can assess his progress. His claims of computer modelled emission reductions are meaningless.
“There are scary rumours the Mayor may be testing or using ‘geofencing’ technology to make vehicles switch to electric mode or other measures to reduce air pollution near monitors used to report legal breaches and warn of smog episodes including within Air Quality Focus Areas e.g. Marylebone. If so, it would seem he learned nothing from the outrage he provoked by spaying glue on roads by these monitors before the Olympics.”
“Clean Air in London encourages campaigners to ask Defra, Transport for London or the Mayor for air pollution information for their local area.
“Last but not least, Clean Air in London wishes to thank barristers Gerry Facenna and Julianne Morrison of Monckton Chambers for their advice in this matter.”
ENDS
Notes
1. Air Quality Focus Areas
http://data.london.gov.uk/datastore/package/air-quality-focus-areas
CAL 281 How the focus areas have been determined
Special thanks to Sian Berry, Campaign for Better Transport and Councillor (Green) in Camden, for producing the interactive map below.
2. Selection of Air Quality Focus Areas
The process for selecting the Air Quality Focus areas is described here:
i. Baseline air quality 2011
ii. Analyse air quality concentrations
iii. Check for exposure
iv. Consider potential local characteristics
v. Cross-border check with boroughs’ LAQM findings
vi. Consider predicted air pollution trends
vii. Define Air quality Focus Areas
3. Health impacts and legal limits
http://erj.ersjournals.com/content/early/2014/02/20/09031936.00114713.abstract
The legal limit for NO2 is an annual mean of 40 micrograms per cubic metre (mg/m3). ClientEarth is currently pursuing legal action against the Government in the Supreme Court to force it to comply with this limit. Separately the European Commission has sent the UK a first written warning for breaching legal limits for NO2 every year since they entered into force in 2010. More at:
4. Questioning the Mayor
Search on “Air Quality Focus Areas” i.e. surrounded by inverted commas.
http://www.london.gov.uk/mayor-assembly/london-assembly/questioning-the-mayor
5. Top 50 worst roads for NO2 – Sunday Times and ITV
http://www.thesundaytimes.co.uk/sto/news/uk_news/National/article1379029.ece
http://www.itv.com/news/london/2014-02-24/fff/
6. Top 10 worst roads for diesel exhaust
7. Mayor claims reductions in emissions at Air Quality Focus Areas
8. Oxford Street actual monitored concentrations so far in 2014 and worst in the world
http://www.londonair.org.uk/london/asp/news.asp?NewsId=OxfordStHighNO2&StartIndex=1
9. Geofencing
http://cityclimateleadershipawards.com/2014-project-london-taxi/
“Geofencing – for the first time London is using GPS-based geofencing as a mechanism to switch hybrid vehicles to its zero emission drive cycle.”
CAL 281 Defra EIR reply re 187 AQ Focus Areas_Redacted
CAL 281 Defra EIR reply_Near_Analysis_2012_NO2_PM_Original_Sort by NO2
CAL 281 Defra EIR reply_Near_Analysis_2012_NO2_PM_Original_Sort by PM25
CAL 281 Defra EIR reply_Near_Analysis_2012_NO2_PM_Original_Sort by PM10