‘Invisible’ air pollution: the biggest public health failing or ‘cover-up’ for decades
Air pollution is much worse than most of us have realised. It regularly exceeds twice World Health Organisation (WHO) guidelines and legal limits near our busiest roads in London and elsewhere. Only smoking causes more early deaths than air pollution in the UK.
In December 2009, ‘Clean Air in London’ (CAL) accused the previous Government of one of the biggest public health failings or ‘cover-ups’ by a Government in modern history. Perhaps amazingly given the seriousness of the accusation, the Environmental Audit Committee (EAC) has twice since confirmed CAL’s findings. In CAL’s view, the current Government is still failing to warn people and may be misleading them with statistics such as: “air pollution has declined significantly in recent decades”; air quality is “good across 99% of the UK”; and “air pollution still reduces life expectancy by an average of six months”.
Let’s rewind. Ambient or outdoor air pollution comprises particles and gases. The particles, which can comprise anything from tiny droplets to diesel soot and tyre and brakewear, are called ‘particulate matter’ and classified by their aerodynamic diameter in microns (one-millionth of a metre (µm) which is about one-hundredth of the thickness of a human hair) e.g. PM2.5 and PM10. The gases, which can coalesce and become particles, are mainly nitrogen dioxide (NO2), ozone (O3) and sulphur dioxide (SO2).
The WHO says there is little evidence to suggest a threshold below which no adverse health effects would be anticipated for particulate matter or, put another way, there is no safe level of human exposure to it. An ‘Update of WHO air quality guidelines’ (AQG) published in February 2008 said ‘The AQG have always addressed exposures and health effects of individual pollutants or indicators (such as PM10 mass, an indicator of a complex pollution mixture with multiple sources). However, as understanding of the complexity of the air pollution mixture has improved, the limitations of controlling air pollution and its risk through guidelines for single pollutants have become increasingly apparent. NO2 for example is a product of combustion processes and is generally found in the atmosphere in close association with other primary pollutants, including ultrafine particles. It is itself toxic and is a precursor of ozone, with which it coexists along with a number of other photochemically generated oxidants. Concentrations of NO2 are often strongly correlated with those of other toxic pollutants. Its concentration is readily measured but needs interpretation as a potential surrogate for a set of sources and the resulting mixture. Achieving guideline concentrations for individual pollutants, such as NO2, may therefore bring health benefits that exceed those anticipated on the basis of estimates of a single pollutant’s toxicity.’ NO2 is not just a molecule therefore as the Government would have us believe.
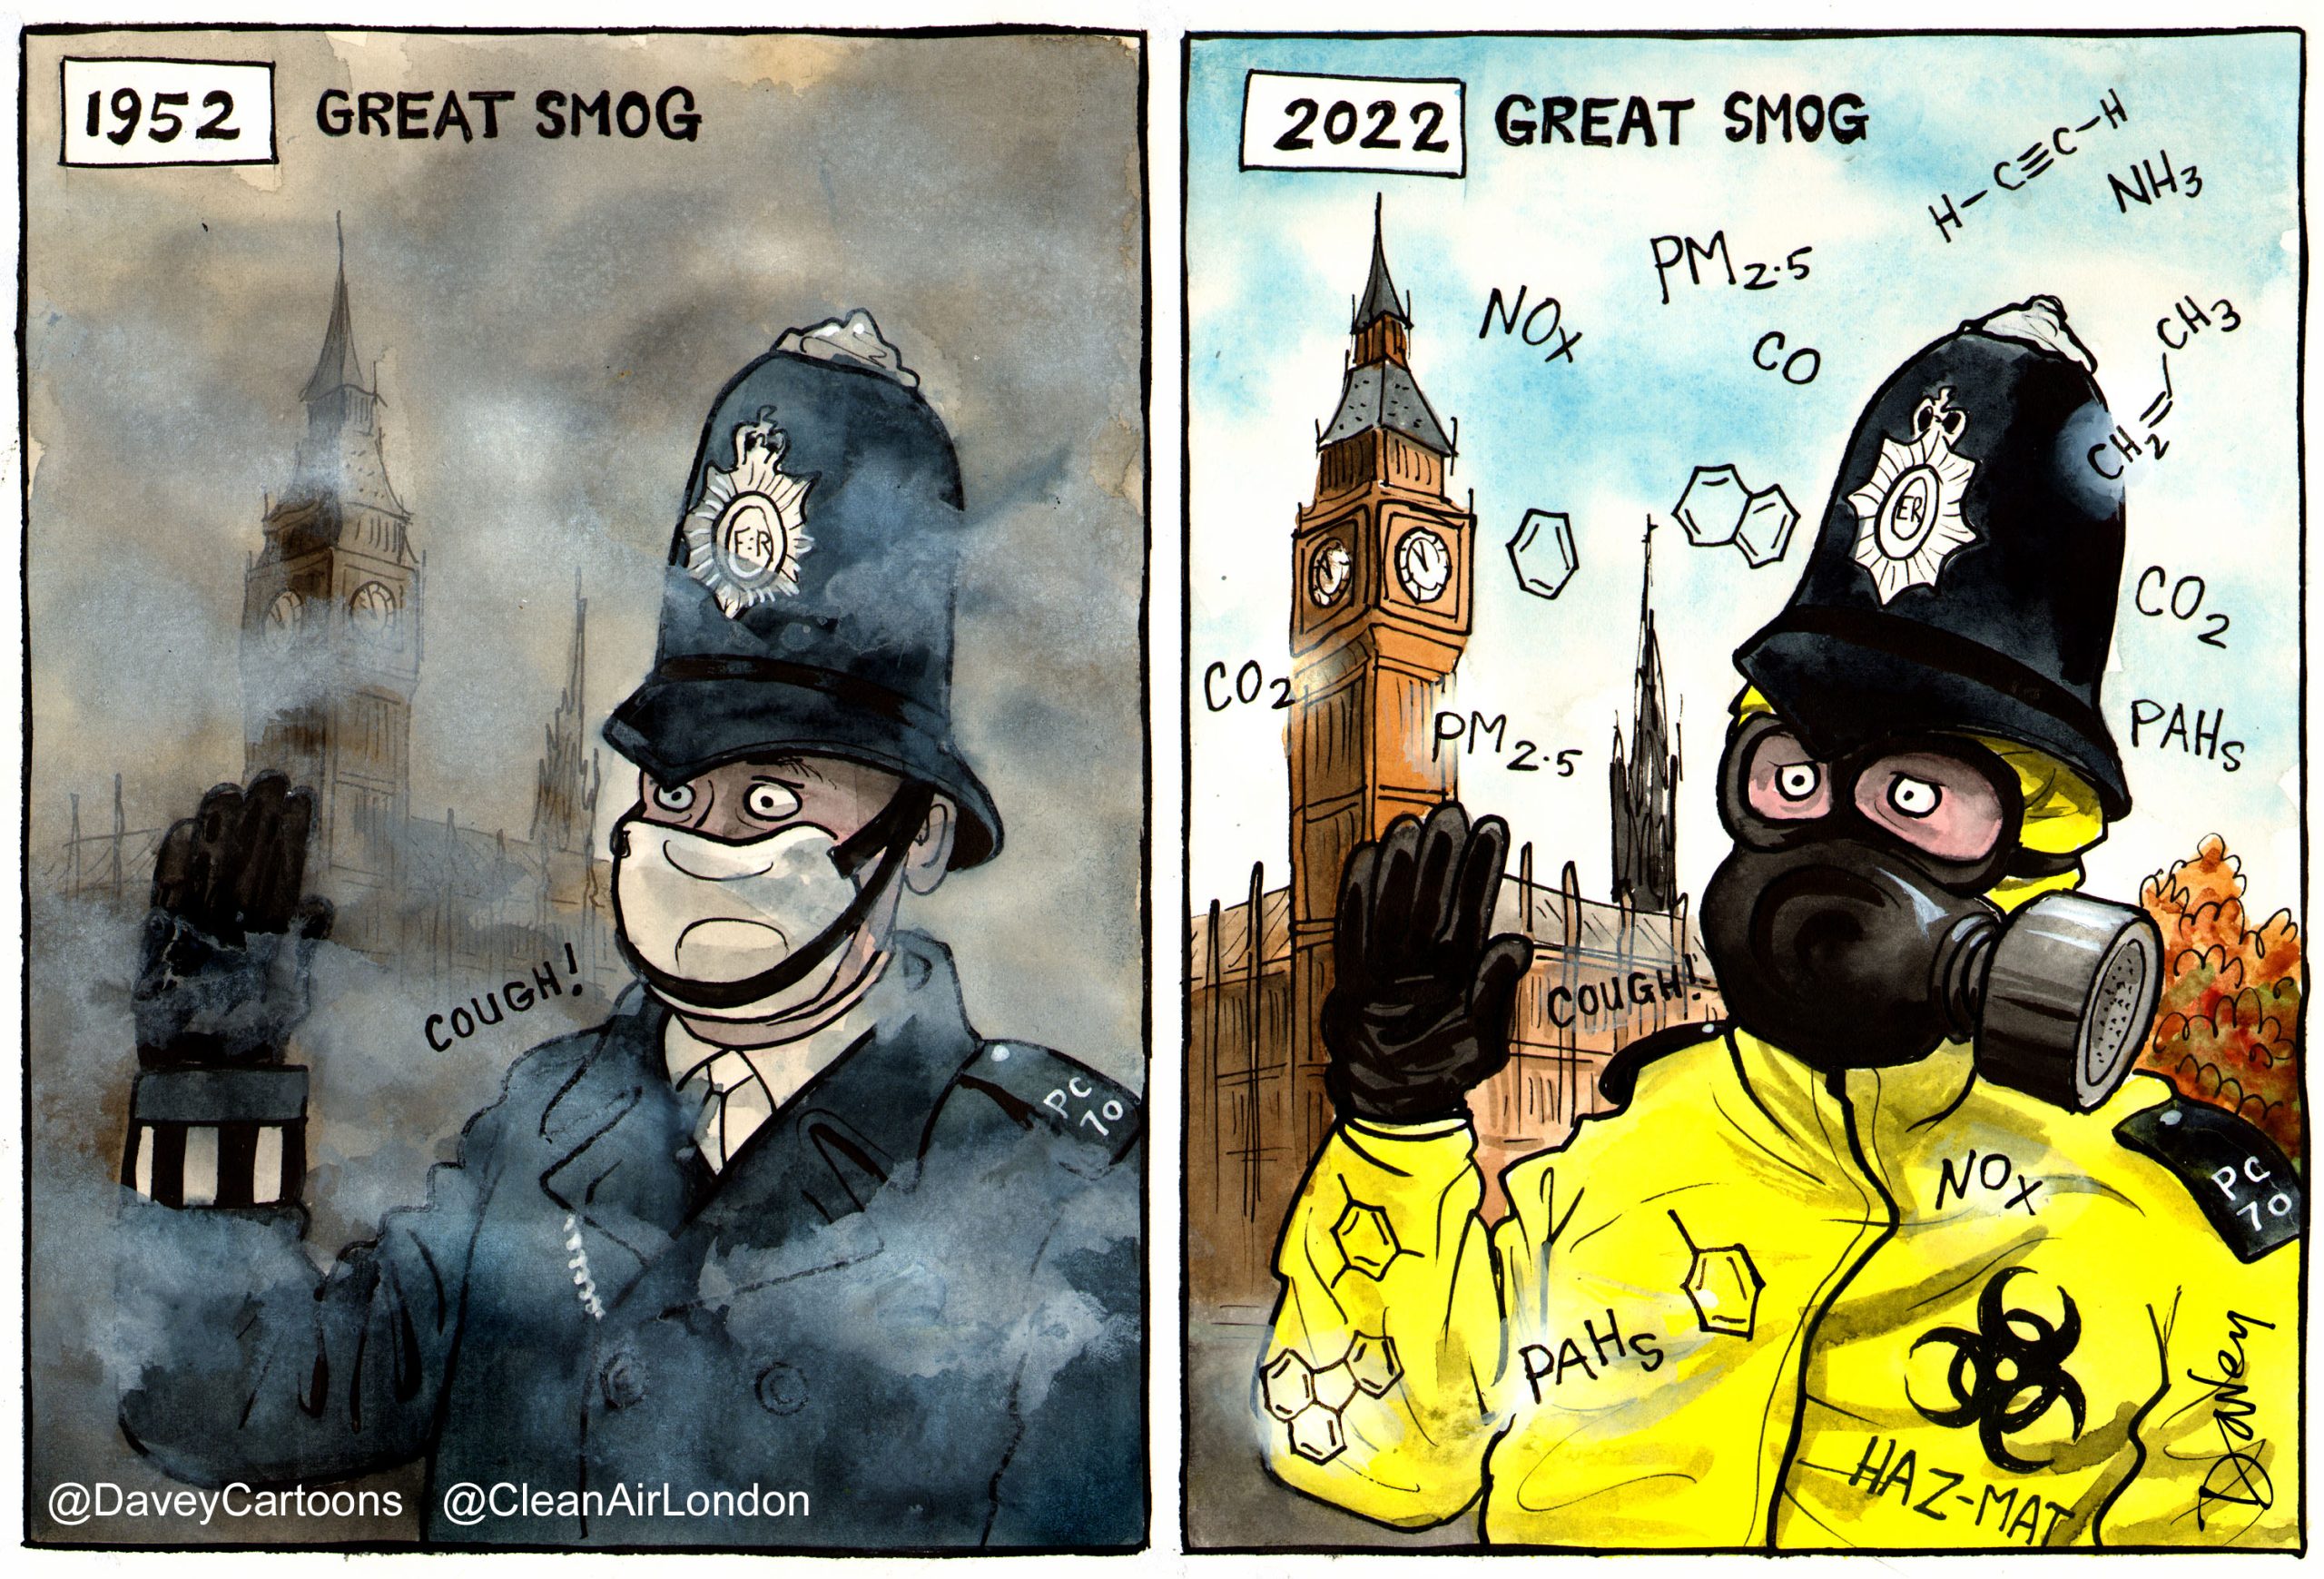
In the Great Smog of December 1952 there were 4,075 deaths in London due to short-term exposure to air pollution with more over the following months. The number was easy to calculate through time-series analysis i.e. the number of deaths peaked about two days after air pollution levels peaked (and didn’t fall into a trough thereafter). Epidemiologists say these people were ‘harvested’ – a disgusting word in this context.
The Committee on the Medical Effects of Air Pollutants (COMEAP) published a report in 1998 on the health impact of short-term exposure to PM10. COMEAP estimated a total of 8,100 deaths ‘brought forward’ due to PM10 annually among total deaths in urban Great Britain (GB) (based on 1995 and 1996 air pollution levels). The same COMEAP report referred to 3,500 deaths brought forward per year due to SO2 in urban areas of GB and between 700 and 12,500 deaths brought forward by O3 in both urban and rural GB during the summer only.
It was not until 1995 and 2000 that huge cohort studies (which followed a group of people over a period of time to determine the absolute risk of one or more health impacts) in cities in the United States with different annual mean concentrations of PM2.5 showed the health impact of long-term exposure to air pollution. The results derived from the American Cancer Society (ACS) (Pope et al, 1995) and the Health Effects Institute (HEI) reanalysis of the ACS study and the US Six-Cities Study (HEI, 2000), which were subsequently confirmed on other continents and within cities, estimated a range of coefficients (i.e. hazard rates or relative risks) from 1% to 9% for a 10 microgram per cubic metre (µg/m3) reduction in PM2.5.
COMEAP reported on these results in 2001 that ‘using the 1% coefficient, the effects of long-term exposure were about ten-fold greater, on a years-of-life-lost basis (i.e. in terms of average life- shortening), than the effects of short-term exposure’. Based on further scientific evidence, COMEAP in June 2009 recommended, as a best estimate for mortality in the UK, the higher risk coefficient of 6% change in risk of death from all causes with a 10 µg/m3 change in PM2.5 derived from the extension of the ACS study (Pope et al, 2002). Oversimplifying, for population weighted exposure of 10 µg/m3 anthropogenic (man-made) and non-anthropogenic PM2.5 in a city with 50,000 deaths in a given year, this equates to 3,000 attributable deaths in a year.
Mayor Johnson was the first politician to use COMEAP’s 2009 advice to publish in June 2010 estimates by ward of 4,267 deaths in London in 2008 attributable to long-term exposure to PM2.5. COMEAP lead the way nationally in December 2010 by estimating, using the language used for alcoholism, obesity and smoking, 29,000 deaths in the UK in 2008 attributable to long-term exposure to PM2.5 at an average loss of life for these people of about 11.5 years. COMEAP and the Mayor’s estimates were calculated after eliminating the effect of dozens of other possible risk factors (e.g. educational status as a surrogate for income and smoking) to produce a pure number assuming air pollution is the sole cause of those deaths. In CAL’s view, these estimates are much more meaningful to members of the public than ‘years of life lost’ or an ‘average loss of life of six months for everyone in the UK’.
The estimates of 4,267 and 29,000 extra or excess deaths are good ones for comparing the effects of air pollution with the effects of other causes such as alcohol, active or passive smoking, obesity, diet etc which are calculated in the same way. However, COMEAP has shown us that because, in practice, individuals experience multiple risks, including air pollution, almost certainly air pollution played some part in shortening the life of a much larger number of individuals. It is not possible to estimate that number reliably but, given that much of the impact of air pollution on mortality is linked to cardiovascular deaths, it is more reasonable to consider that air pollution may have contributed to all 200,000 deaths due to cardiovascular causes in the UK in 2008 (i.e. one in three of all deaths) at an average additional loss of life for these people of about two years (at typical ages for cardiovascular deaths e.g. 15% of which are before age 65).
Combining therefore the short and long-term impacts of different pollutants suggests a range of between 29,000 and 53,100 nationally if there is no overlap or 100% overlap between the health effects. For the first time, we can compare easily the health impact of long-term exposure to PM2.5 with the Government’s estimates for the number of premature deaths attributable to alcoholism (15,000 to 22,000 in England; average men 20 years, women 15 years), obesity (9,000 in England; average nine years) and smoking (87,000 in England; average 10 years) and understand the complexities of these metrics. There were 2,222 deaths from road traffic accidents in GB in 2009.
The health impact of air pollution is not just about mortality; it is also about morbidity i.e. illness. Separate scientific research published by the Aphekom group of scientists in 2011 has shown that those living near roads travelled by 10,000 or more vehicles per day on average could be responsible for some 15-30 per cent of all new cases of asthma in children; and of COPD (chronic obstructive pulmonary disease) and CHD (coronary heart disease) in adults 65 years of age and older. The same study further estimated that, on average for all 10 cities studied, 15-30 per cent of exacerbations of asthma in children, acute worsening of COPD and acute CHD problems are attributable to air pollution. This burden is substantially larger than previous estimates of exacerbations of chronic diseases, since it has been ignored so far that air pollution may cause the underlying disease as well. Related research indicates that associations of asthma with traffic-related pollution from nearby sources at schools were independent of estimated effects of exposures at homes. A Freedom of Information request to Transport for London by CAL has found 1,148 schools in London within 150 metres of roads carrying over 10,000 vehicles per day and a total of 2,270 within 400 metres of such roads.
Nor is the health impact of air pollution spread evenly across the population. The EAC said “Preliminary results for England indicate that poor air quality is associated with areas of low income, low employment and lower education attainment, with differences in exposure to air pollution between different ethnic groups”. CAL which saw these results, from work done by Imperial College’s highly respected Small Area Health Statistics Unit (SASHU), presented at the International Society for Environmental Epidemiology (ISEE) conference in Barcelona on 16 September 2011 recollects that the worst effected groups were exposed to up to 50% more NO2 than those least effected i.e. the health inequalities linked to combustion related air pollutants are up to twice those for PM10. The research presented in Barcelona was titled “Associations between small area levels of air pollution and socio-economic characteristics in the Netherlands and England”. A detailed report for Defra in 2006 showed that inequalities are greater in areas with poorest air quality. CAL has analysed marginal Parliamentary constituencies and zones breaching NO2 limit values.
In conclusion, it is fair to point out there were as many early deaths in London in 2008 due to long- term exposure to PM2.5 as we thought occurred during the Great Smog of 1952 (due to short-term exposure to air pollution when we knew nothing of the long-term effects). Put another way: knowing that there were 4,000 early deaths in the Great Smog of 1952 was enough to ‘change the world’; but knowing there were 4,000 early deaths in London in 2008 is now considered by some ‘room for improvement’.
We must not let this ‘invisible’ public health crisis be ignored any longer. Just because air pollution was visible in 1952 and the effects short-term, does not excuse ignoring the invisible, long-term effects now. Who knows what further health risks the scientists will identify 10 years from now? Officials should stop saying they’re worried about alarming people about the dangers of air pollution and start warning them. It is a disgrace, for example, that it is much harder to find a list of cities and towns in the UK where NO2 diffusion tube data shows legal limits are breached than it was three or four years ago. The Government should also be warning people that indoor air quality can be worse than outdoor and revising advice from 1998 on ‘tunnel dust’ in the London Underground.
The solutions are simple. The Government should accept immediately and in full the recommendations of the two EAC reports. In particular, it should implement a massive campaign on the scale of those for alcoholism and smoking to building public understanding of the dangers of air pollution with advice for people on protecting themselves and reducing pollution for themselves and others. Some 90% of people at a conference on air quality in 2010 said they wanted to see an estimate for their local authority of the number of deaths attributable to long-term exposure to PM2.5 with advice on the careful interpretation of the information.
It’s time for change. London and the UK should be leading the world in the Olympic year in tackling air pollution as we did after the Great Smog of 1952.
This is the first in a series of six articles being written for Politics Home by Simon Birkett, Founder and Director of Clean Air in London, about air quality in the lead up to the London 2012 Olympics. The six articles will address health impacts, legal issues, sources, solutions and opportunities; indoor air quality; and the Olympics.
CAL 186 Health impacts_DH estimates for alcoholism_dh_085312
CAL 186 Health impacts_DH estimates for obesity 2007
CAL 186 Health impacts_DH estimates for smoking_dh_091384
CAL 186 NICE salt and saturated fat 180610
CAL 238 DODs poll Clean Air in London